The Chart Builder tool
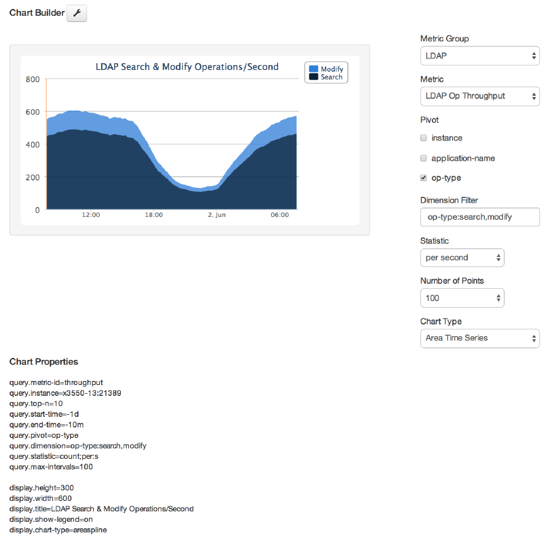
The Chart Builder tool is used to create performance charts for all configured servers.
The Chart Builder tool (chart-builder.vm) is shipped with the PingDataMetrics server and is enabled after installation at the following URL: https://<metricshost>:<port>/view/chart-builder.
As the settings in the Chart Builder are changed, the builder gathers the data from the PingDataMetrics server using the PingDataMetrics server REST API. After it has been configured, the dashboard page asynchronously fetches metric data for all charts, with each chart rendering when its data is returned. While most metric queries respond quickly (50-100ms), some queries can take longer. If the lag seems too long, consider making changes to the query to reduce the amount of data gathered.
Selecting specific instances and using dimension filters can decrease query time. The Chart Builder tool and the underlying libraries constrain a chart to a single metric. The size of each chart is determined by the library default size (300x300) and can be overridden in the chart properties file. There are times when the legends and labeling of a chart dictate the minimum size for a chart.

The metrics parameters used to build the chart can be saved to a properties file and added to a dashboard. If not using the Chart Builder tool, the _chart-definition.template file in <server-root>/config/dashboard/charts provides instructions about manually creating charts and adding them to a dashboard.