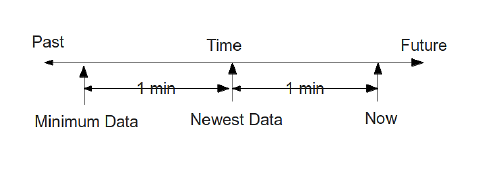
Threshold time line
The PingDataMetrics server periodically evaluates each threshold, computing current value, current average, and alerted state.
The default evaluation period is 30 seconds. Using the figure below, a threshold is evaluated at time 'Now.' The most recent data that threshold uses is one minute old (Newest Data). Each threshold evaluation requires at least one minute of new data (Minimum Data). At time 'Now,' the threshold is working with data that is between one and two minutes old (between Minimum Data and Newest Data).

The one minute delay between 'Now' and 'Newest Data' is not configurable. This delay ensures that the PingDataMetrics server has had enough time to poll the monitored servers and get the most recent data. The one minute delay between 'Newest Data' and 'Minimum Data' is configurable on a per-threshold basis for Spike-valued thresholds, but one minute is the minimum window. Generally, time between when a monitored performance anomaly occurs on a monitored system, and when an alert is created will be between two and three minutes
Because the PingDataMetrics server can capture metrics data with a very fine time resolution (one second data is the default), the data is often very "noisy." By default, the data is time-averaged (using five consecutive one-second samples to produce a single five-second value), and time-averaging will ultimately reduce the noise. However, "noisy" data can make it harder to choose an appropriate threshold limit value. If the limit value is too close to the noise levels, the threshold will alert because of values that have a very short time duration.
Each threshold is configured with a minimum-time-to-trigger property, which determines the minimum time allowed to exceed the threshold before an alert is generated, and a minimum-time-to-exist property that determines the time required for the threshold to exit an alerted state.