Setting up Grafana
Use Grafana with either Graphite or Prometheus to view data through interactive dashboards with charts and graphs.
Steps
-
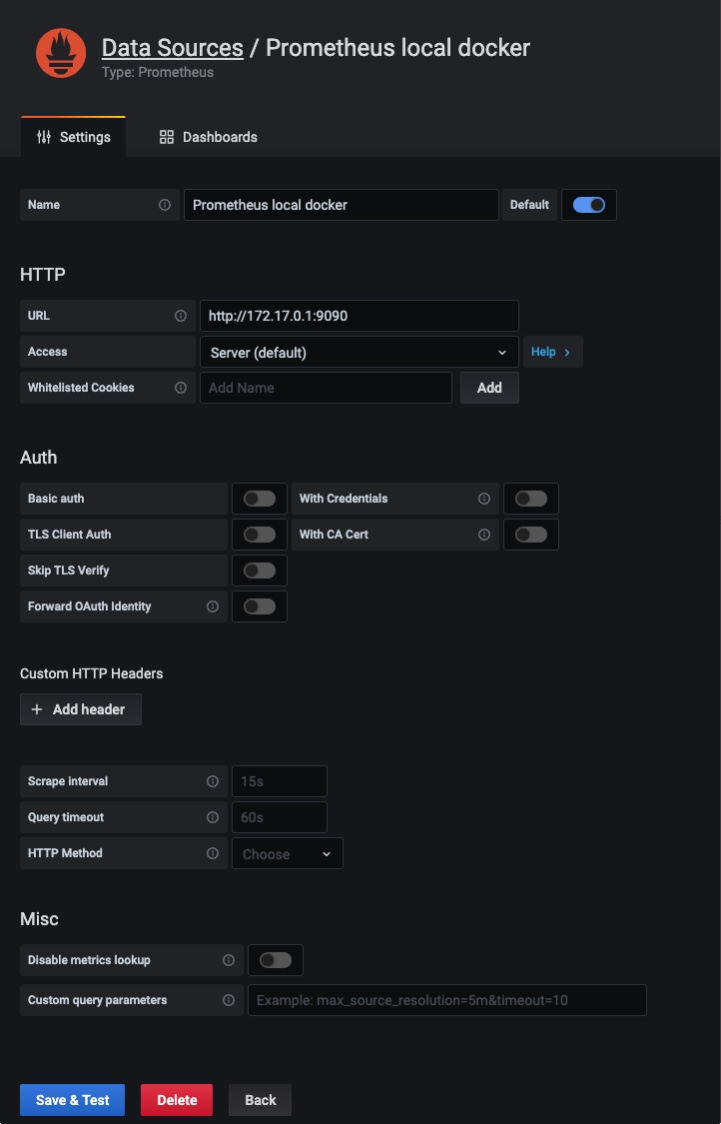
Connect Grafana to either Prometheus or Graphite by adding a data source with the information shown in this example.

The URL you enter in the URL field should reflect the location of your time series database.
-
Click Save and Test.
-
Access Grafana.
For more information, see Accessing Prometheus and Grafana.