Monitoring PingCentral
The Spring Boot Actuator, enabled by default, collects a wide variety of information to help you monitor and manage PingCentral in production environments and can be connected to your time series database in a few simple steps.
Spring Actuator data and Spring Metrics can be accessed at their respective endpoints:
Actuator data includes:
| Endpoint | Usage |
|---|---|
|
Displays a list of the Spring beans in PingCentral. |
|
Displays a list of available caches. |
|
Displays the conditions that were evaluated on configuration and auto-configuration. |
|
Displays a list of configuration properties. |
|
Displays a list of environment properties. |
|
Returns a list of environments in PingCentral and their connectivity statuses. |
|
Returns connectivity status of the specified environment. |
|
Displays health check information regarding PingCentral. |
|
Used to perform a heap dump. |
|
Displays general information about PingCentral, such as the vendor and version number. |
|
Displays information regarding database migrations that have been applied. |
|
Displays the logger configuration for PingCentral. |
|
Displays a collated list of all @RequestMapping paths. |
|
Displays the scheduled tasks within PingCentral. |
|
Used to perform a thread dump. |
Metrics data includes a wide variety of information, such as the amount of JVM (Java Virtual Machine) memory used, the number of Jetty threads used, and the amount of time it takes to complete processes. Counters and timers are also available for most API endpoints. Counters count the number of times an endpoint is hit, and timers measure the amount of time it takes for events to occur.
Spring Metrics collects a large amount of data, but it does not present the data in ways that are easy to understand. Consequently, many choose to move this data to either a Prometheus or Graphite time series database and use Grafana to view it through interactive dashboards with charts and graphs.
Because Graphite supports only counters, but Prometheus supports both counters and timers, Prometheus is the preferred choice. See the following topics for instructions on setting up one of these time series databases to communicate with PingCentral.
Setting up Prometheus using basic authorization
Prometheus pulls information from PingCentral endpoints and stores the data it retrieves.
Steps
-
In PingCentral, in the
conf/application.propertiesfile, which resides in the PingCentral installation directory, locate and define the following properties.management.metrics.export.prometheus.enabled=true management.metrics.export.prometheus.step=5s
-
Save and close the file.
-
Restart PingCentral.
-
Set up the Prometheus
prometheus.yamlconfiguration file and save it in the appropriate location.Example:
The following example uses the
prometheus.yamlfile locally withbasic_auth:global: scrape_interval: 15s # Set the scrape interval to every 15 seconds. Default is every 1 minute. # scrape_timeout is set to the global default (10s). # A scrape configuration containing exactly one endpoint to scrape: # Here it's Prometheus itself. scrape_configs: # Metrics for PingCentral - job_name: 'pingcentral-metrics' honor_timestamps: false metrics_path: */actuator/prometheus' scrape_interval: 5s scheme: https static_configs: - targets: [ 'xxx.xxx.x.x:9022' ] basic_auth: username: Administrator password: 2Federate tls_config: insecure_skip_verify: trueUse
insecure_skip_verification: trueexclusively in development or test environments. -
Access Prometheus.
For more information, see Get started with Grafana and Prometheus in the Grafana documentation.
Setting up Prometheus using OAuth
Prometheus pulls information from PingCentral endpoints and stores the data it retrieves.
Before you begin
-
Enable single sign-on (SSO) with OpenID Connect (OIDC) in PingCentral’s
application.propertiesfile. -
Register an OAuth client in an authorization server with
grant_type =
client_credentials
. Include the claims: 'sub', 'aud', and 'PingCentral-Role' in an issuedaccess_token. -
Configure the
Resource Serversection in theapplication.propertiesfile.
For more information, see Setting up SSO for PingCentral.
About this task
To configure Prometheus to connect to PingCentral with OAuth credentials:
Steps
-
In PingCentral, in the
conf/application.propertiesfile, which resides in the PingCentral installation directory, locate and define the following properties.management.metrics.export.prometheus.enabled=true management.metrics.export.prometheus.step=5s
-
Save and close the file.
-
Restart PingCentral.
-
Set up the Prometheus
prometheus.yamlconfiguration file and save it in the appropriate location.Example:
To use an OAuth access token, use your OAuth credentials as configured in PingFederate or your third party authorization server. See the following example:
global:
scrape_interval: 15s # Set the scrape interval to every 15 seconds. Default is every 1 minute.
# scrape_timeout is set to the global default (10s).

# A scrape configuration containing exactly one endpoint to scrape:
# Here it's Prometheus itself.
scrape_configs:
# Metrics for PingCentral
  - job_name: 'pingcentral-metrics'
    honor_timestamps: false
    metrics_path: */actuator/prometheus'
    scrape_interval: 5s
    scheme: https
    static_configs:
      - targets: [ 'xxx.xxx.x.x:9022' ]
    oauth2:
      client_id: prometheusPCClient
      client_secret: srZS9odxQF7m1tHUkUMcPvtSyz4P8XzVhy3CKn7VOOsBODYtBspRl2AXtExG2Q4Z
      scopes:
        - pc-admin-api
      token_url: https://pingfederate:9031/as/token.oauth2
    tls_config:
      insecure_skip_verify: true
Use
insecure_skip_verification: trueexclusively in development or test environments. -
Access Prometheus.
For more information, see Get started with Grafana and Prometheus in the Grafana documentation.
Setting up Graphite
Use PingCentral to push data to the Graphite time series database.
Steps
-
In PingCentral, in the
conf/application.propertiesfile, which resides in the PingCentral installation directory, locate and define the following properties.management.metrics.export.graphite.step=5s management.metrics.export.graphite.enabled=true management.metrics.export.graphite.host=127.0.0.1 management.metrics.export.graphite.port=2004
-
Save and close the file.
-
Restart PingCentral.
Result:PingCentral automatically starts pushing data to Graphite.
Accessing Prometheus and Grafana
At Ping, we use Prometheus and Grafana to monitor PingCentral in our Docker PingCentral deployment in our CI/CD.
To access Prometheus and Grafana, use URLs that reflect their installation locations using the following format:
- Prometheus
-

To ensure Prometheus is correctly gathering metrics from PingCentral, use
- Grafana
-

Setting up Grafana
Use Grafana with either Graphite or Prometheus to view data through interactive dashboards with charts and graphs.
Steps
-
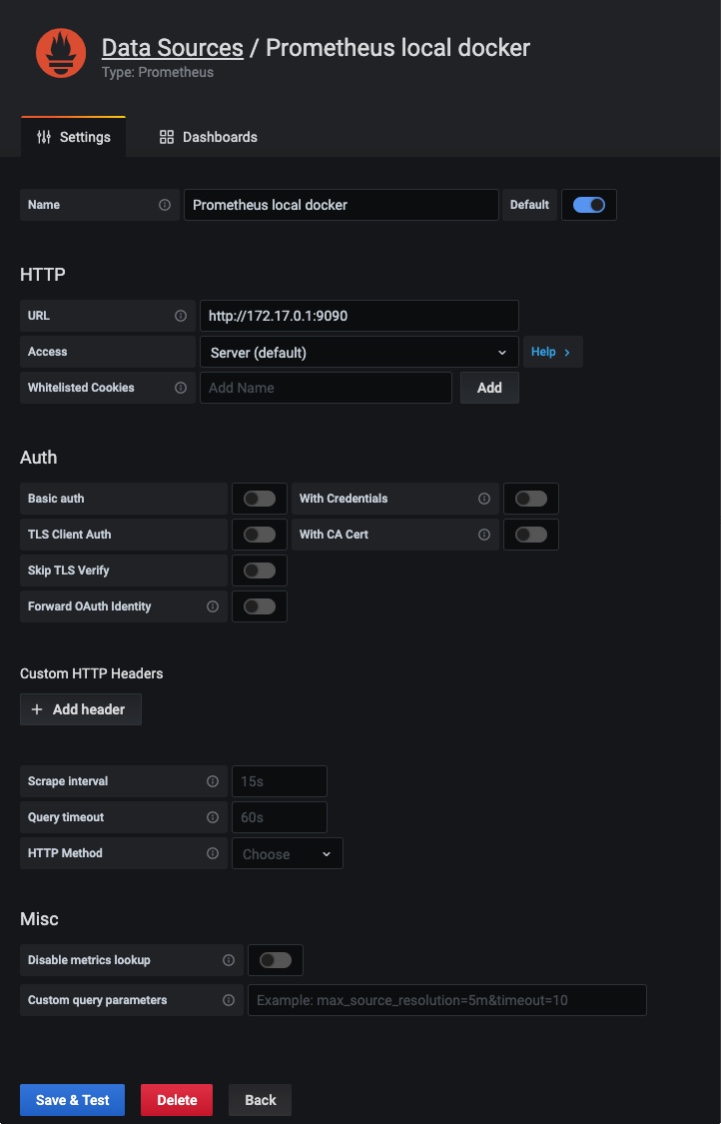
Connect Grafana to either Prometheus or Graphite by adding a data source with the information shown in this example.

The URL you enter in the URL field should reflect the location of your time series database.
-
Click Save and Test.
-
Access Grafana.
For more information, see Accessing Prometheus and Grafana.