Available dashboards
The PingDataMetrics server includes several dashboards that can be used to display information for all servers in a data center, specific applications, or service level agreement (SLA) specifics.
The following dashboards are available:
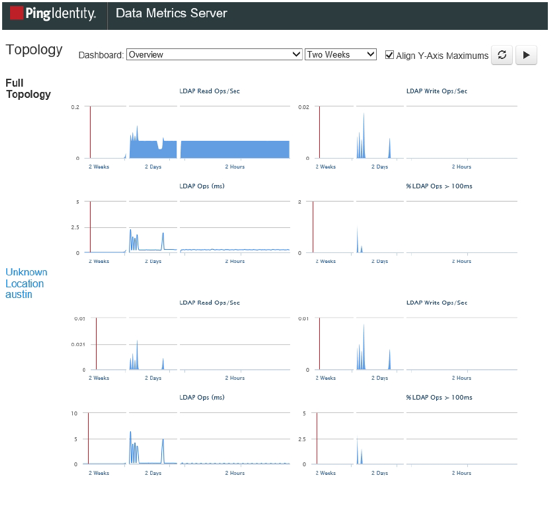
ldap-dashboard
Displays charts for PingDirectory server, PingDirectoryProxy server, and PingDataSync servers configured with the monitored-servers command. Charts are also displayed for the PingDataMetrics server. This dashboard is viewed from a browser at http://<metrics-host>:<port>/view/ldap-dashboard, and is easily customized. For more information, see Customize the LDAP dashboard. The charts can display information by:
-
Individual server, server location, or server type.
-
Varying level of detail adjusted by server type.
-
Time scale, providing either a recent or more historical data view.

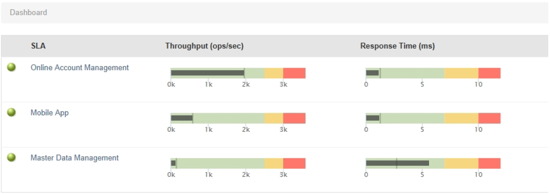
sla-viewer
Displays throughput and response time graphs, and status for configured SLAs. This dashboard is viewed from a browser at
http://<metrics-host>:<port>/view/sla-viewer. See Monitoring for Service Level Agreements for information about configuring SLAs.

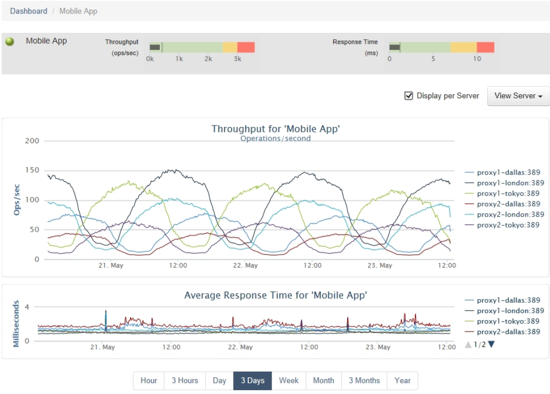
sla-viewer-details
Displays SLA Viewer data and additional charts for response time and time ranges from the sla-viewer dashboard. Data can be viewed per server and includes server details.

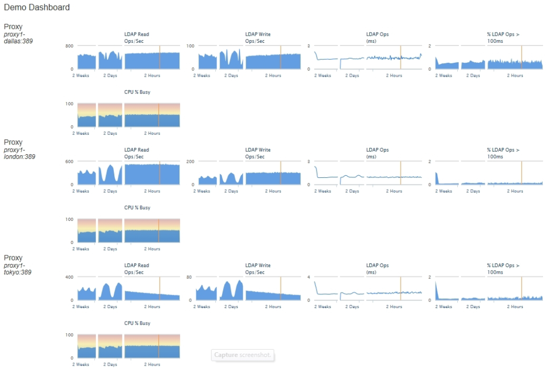
demo-dashboard
Demonstrates how to display a set of charts for multiple servers and how to vary that set of charts per server type. This dashboard is viewed from a browser at http://<metrics-host>:<port>/view/demo-dashboard. You can use the dashboard as a starting point for custom dashboards.

A dashboard .readme file provides general instructions for customizing any dashboard, and is located in <server-root>/config/dashboard/dashboard.README.
You can create and reference custom style sheets in the dashboard template or configure styles for all charts. See Chart Presentation Details for information. The PingDataMetrics server default style sheets should not be modified.