Monitoring
This topic outlines the key JVM performance metrics for evaluating the performance of a PingFederate deployment.
After a connection is established, you can access the JConsole monitoring interface.
Monitoring clustered PingFederate engines
JConsole can be connected to multiple processes. To monitor several instances of PingFederate after a connection is established, click Connection > New Connection and add the additional connection.
Monitoring CPU utilization
The Overview tab provides a dashboard of the following performance and resource-utilization charts:
-
Heap Memory Usage (cumulative memory that is used by all memory pools).
-
Live Threads
-
CPU Usage
-
Classes (number of classes that are loaded)
This tab provides a high-level view of the JVM’s performance metrics.
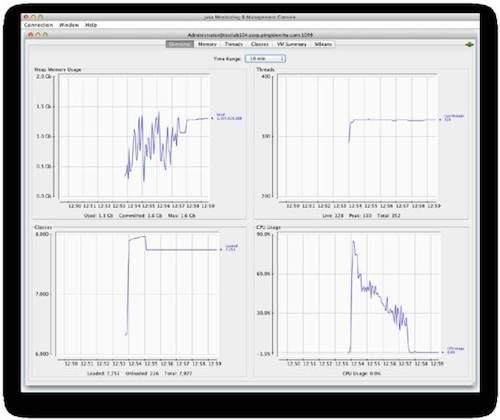
Use the Overview tab to visualize and collect CPU usage data. When your PingFederate deployment is subjected to its normal or expected load, the CPU utilization typically falls between 60 and 80%. If the system registers consistently at 80% or higher, additional CPU resources might be necessary to handle load spikes that occur during peak usage times.
Monitoring memory utilization
The Overview tab shows only overall heap usage. To view additional details about memory utilization, click the Memory tab, which lets you analyze usage patterns in specific memory pools within the heap. This tab also provides information about the overall heap utilization profile.
Old Generation space
Objects that survive a sufficient number of garbage-collection cycles are promoted to the Old Generation. To view the memory usage in the pool of such objects, click Memory Pool > PS Old Gen or Memory Pool > G1 Old, depending on the relevant garbage collection. PingFederate services mostly short-lived transactions, like SSO, STS, and OAuth requests and most of the created memory objects are required only for a short period of time.
Although PingFederate makes use of some memory objects that are medium to long lived, such as session data for authentication session, adapter sessions, or single logout functionality, most of the objects that are promoted to the Old Generation are likely to become garbage that requires cleaning up. If the younger generation, or Eden space, is not sized appropriately, objects are moved to and retained in the Old Generation before they are collected as garbage. If size limitations prevent the Old Generation from accumulating future garbage as well as longer-lived objects, then garbage-collection cycles occur more frequently.
The Old Generation space is the most important space to monitor. It is easy to identify if the heap is sized and proportioned appropriately for a specific load, based on its usage pattern. The following examples involve two Old Generation usage charts. In both examples, the following examples involve two Old Generation usage charts. In both examples, the same user load executes the same workflow. The size of the heap represents the only difference.
Garbage collection frees around 60 to 75% of the space, and room is available to accommodate the future garbage of newly created objects that are moved from the Eden space, as well as the longer-term objects that remain in use. Although the space is 1 GB in size, the average full (PS MarkSweep or G1 Old Generation) collection time is approximately only 240 milliseconds (0.728 seconds for three collections).
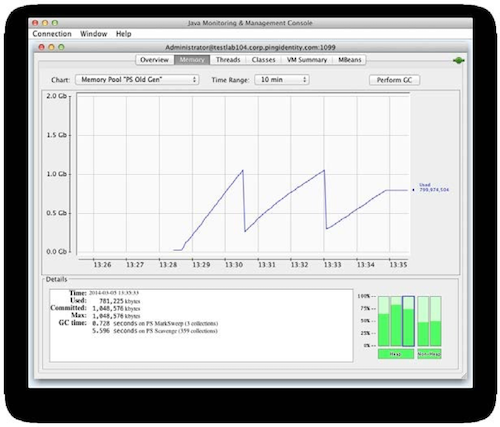
When a heap is sized inadequately, the Old Generation runs out of space. In the following example, the amount of memory that becomes free with each garbage collection shrinks, due to the rate at which objects are promoted from the Eden space.
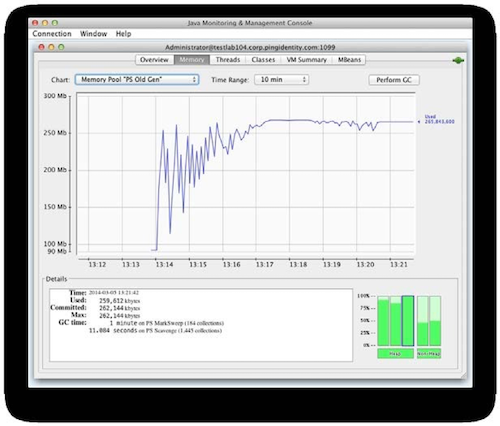
184 PS MarkSweep (full) collections require garbage collections more frequently, totaling 60 seconds, or an average of 326 milliseconds per collection.
Entire heap space
If the heap is sized appropriately for the load that the system must handle, it fills up and is followed by an appreciable drop in usage as a full garbage collection occurs (such as a PS MarkSweep collection triggered by the Old Generation filling up). In this example, the heap rises steadily, with drops from minor collections until a PS MarkSweep collection occurs and collects approximately 70% of the heap.
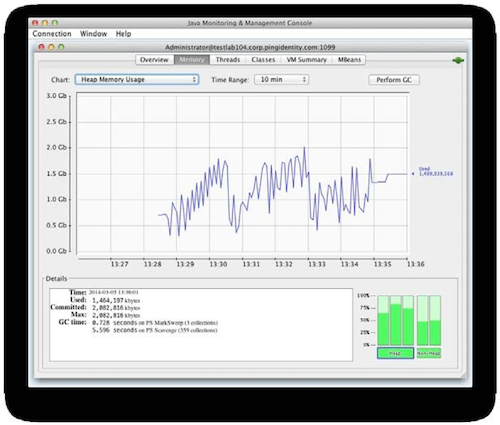
When the heap is undersized, full collections that are performed more frequently return less memory. In the following example, the frequency of JMX data that the JConsole retrieves does not keep pace with the frequency of full collections. As a result, only a fraction of them occur.
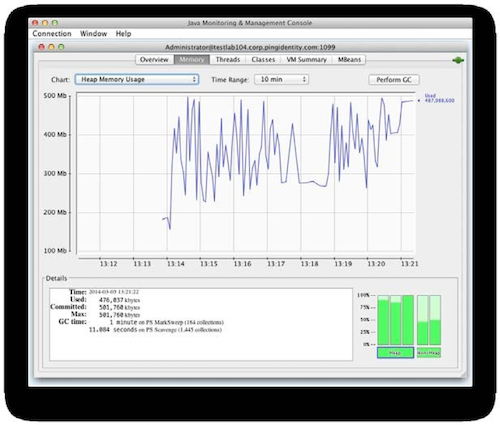
Eden space
Regardless of whether the heap is adequately sized or undersized, the usage pattern is nearly identical with the Eden space. This similarity can be due to the sampling frequency of the data-collection tool because the number of samples might be insufficient to show that, with an undersized heap, memory is consumed and subsequently freed with greater frequency. The behavior of garbage collection in the Eden space is such that when it fills, the space is completely emptied by moving live objects to the Survivor and Old Generation spaces. Under load, the pattern resembles a jagged sawtooth, as shown in the following examples of an adequately sized heap and an undersized heap.
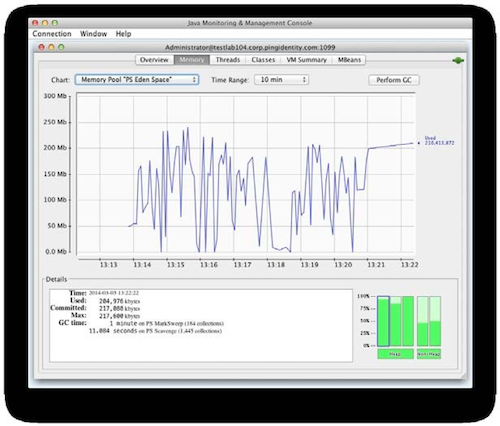
Increasing heap size
Because garbage collectors manage memory in the Java Runtime Environment, simply increasing the size of the heap is not always the appropriate solution. The following table outlines the total heap size recommendations for the available garbage collectors, based on available CPU resources.
| Garbage Collector | Minimum Recommended Number of CPUs | Recommended Heap Size |
|---|---|---|
Parallel |
4 |
6 GB maximum |
Concurrent Mark Sweep |
12 |
4 - 6 GB minimum |
Garbage First (G1) |
12 |
6 GB minimum |
If additional memory is unavailable, or if increasing the size of the heap is inadvisable because of these recommendations, the load that is handled by this instance is probably too high. In such instances, consider adding additional resources to your deployment. To verify whether the load for the instance is too high, check the CPU utilization
To allow for the most efficient management of memory, set the minimum and maximum heap sizes to the maximum allowed values to avoid potentially expensive heap allocation resizing and divide it evenly between the young and old generations. If you are using the Garbage First collector, generational spaces are not specified through command line options because they are managed logically in real time. Even in such instances, we recommend setting the minimum and maximum heap sizes to the maximum allowed values.
Learn more about fine-tuning the JVM options in the jvm-memory.options file in Fine-tuning JVM options.