Monitoring active and passive administrative nodes
Monitor the synchronization status of the active and passive admin consoles using the administrative console, the heartbeat endpoint, or the administrative API.
Monitoring active and passive admin consoles using the admin console
To check the status of the active and passive admin consoles using the active admin console, go to System > Server > Cluster Management.
Click the All Admin Consoles tab to see the synchronization status and timestamp of the most recent synchronization for each node. The current console being used to view this information is indicated with an arrow.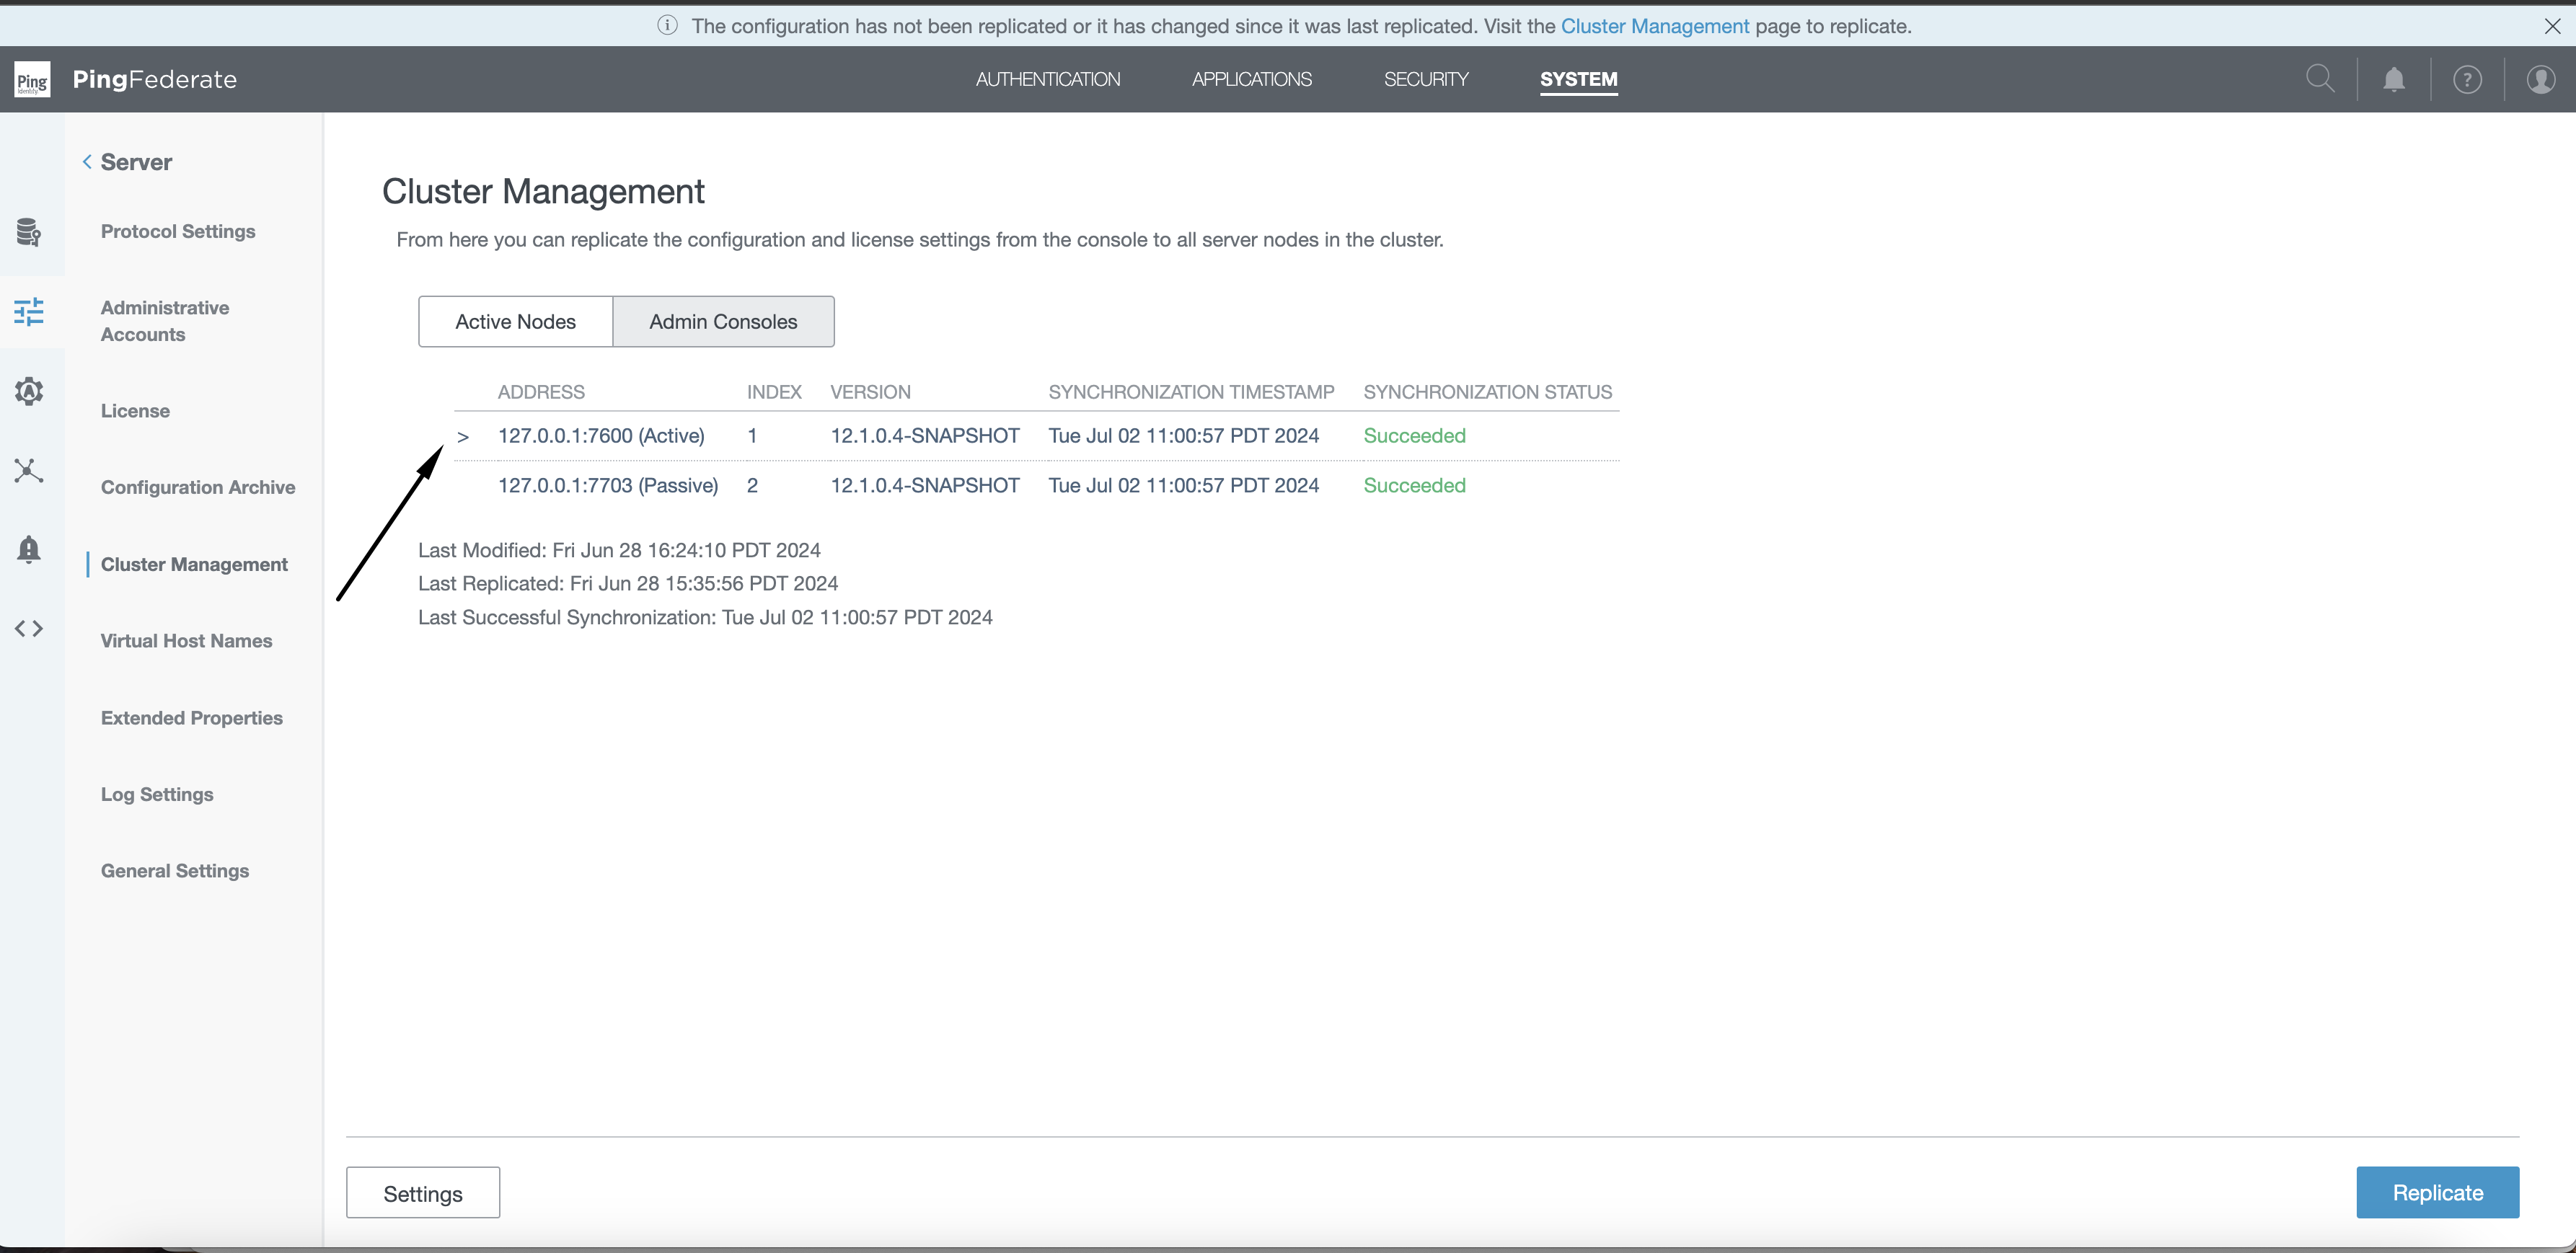
Passive nodes display the status and timestamp of their most recent synchronization.
The active node displays the status and timestamp of the most recent successful synchronization with a passive node.
The following table lists the possible synchronization statuses:
| Status | Description |
|---|---|
None |
No synchronization has occurred |
Retrieving |
Synchronization request has been sent and node is attempting to retrieve the synchronization data |
Applying |
Node is attempting to apply the downloaded configuration |
Failed |
Unable to complete synchronization |
Succeeded |
Synchronization was successful |
|
The active admin console only displays None or Successful. |
Monitoring active and passive admin consoles using the heartbeat endpoint
To monitor the status of active and passive admin consoles using the heartbeat endpoint (pf/heartbeat.ping), customize the heartbeat message to include active/passive admin console status.
Learn more in Customizing the heartbeat message.
The following example response includes active/passive admin console parameters:
{"items":[{
...
admin.console.role: "ACTIVE",
admin.console.role.last.updated: "2024-06-12T21:22:14.188643Z",
admin.console.sync.status: "SUCCEEDED",
admin.console.sync.timestamp: "2024-06-12T21:25:23.620Z",
cluster.members: "[127.0.0.1:7600, 127.0.0.1:7603, 127.0.0.1:7604, 127.0.0.1:7602]",
cluster.members.detail: "[{address=127.0.0.1:7600, mode=CLUSTERED_CONSOLE, consoleRole=ACTIVE, consoleRoleLastUpdated=2024-06-12T21:22:14.188643Z, consoleConfigSyncStatus=SUCCEEDED, consoleConfigSyncTimestamp=2024-06-12T21:25:23.620Z}, {address=127.0.0.1:7603, mode=CLUSTERED_CONSOLE, consoleRole=PASSIVE, consoleRoleLastUpdated=2024-06-12T21:15:21.622079Z, consoleConfigSyncStatus=SUCCEEDED, consoleConfigSyncTimestamp=2024-06-12T21:25:23.310Z}, {address=127.0.0.1:7604, mode=CLUSTERED_CONSOLE, consoleRole=PASSIVE, consoleRoleLastUpdated=2024-06-12T21:15:21.641449Z, consoleConfigSyncStatus=SUCCEEDED, consoleConfigSyncTimestamp=2024-06-12T21:25:23.698Z}, {address=127.0.0.1:7602, mode=CLUSTERED_ENGINE}]",
...
}]}|
For passive nodes, add the query-param This query-param has no effect on active nodes. On a healthy active node, it will return a |
Monitoring active and passive admin consoles using the administrative API
Learn more about using the administrative API to monitor active and passive admin consoles in Active and passive administrative console endpoints.