Troubleshooting policy queries
The following resources can help you solve issues with policy query requests and responses.
Configuring query response granularity
A query response includes a set of decisions. Each decision is executed against a possible combination of request attributes. By default, query responses return two types of decisions:
-
PERMIT -
DENYwith statements attached
Adjust the granularity of query responses by configuring the query response view:
-
In the administrative console, go to Authorization and Policies and click Policy Decision Service.
-
In the Policy Query Configuration section, select the response granularity in the Query Response View list.
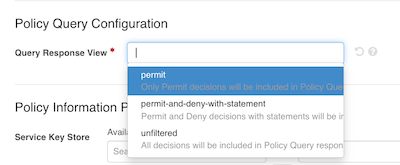
The following table describes the behavior of each available query response view:
| Response view | Description |
|---|---|
|
Only includes |
|
Includes |
|
Includes all decisions in the query response, regardless of the outcome or the presence of statements. You can use this view can help diagnose unexpected decision outcomes for specific combinations of attributes. |
Alternatively, you can add the x-respond-with header to your query requests and assign it one of the following values:
-
permit -
permitAndDenyWithStatement -
unfiltered
|
The configured query response view will apply to responses in both embedded and external policy decision point (PDP) mode. |
Visualizing policy query decisions
As part of the policy development and debugging process, you can examine recent decisions returned in a query response.
About this task
When you develop and test policies, you can examine the decision flow and other details about recent decisions to make sure the decision engine is evaluating policies according to your expectations.
Steps
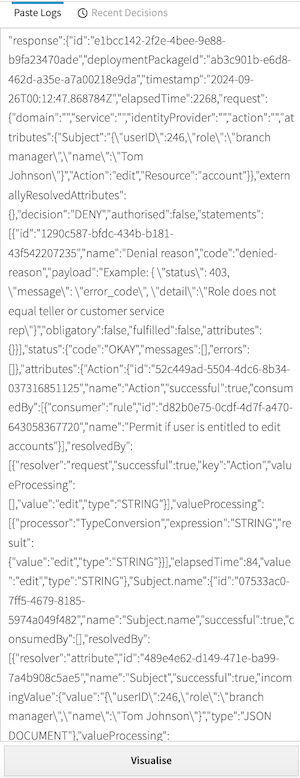
-
In the
policy-query.logfile, copy theresponsefield for the individual query permutation for which you want to visualize the corresponding decision."response":{"id":"38be8a7e-b552-4fd8-9311-4b742dc71280","deploymentPackageId":"38288f2d-f7ca-4c1c-ada4-0d6ef878de38","timestamp":"2024-09-09T14:44:19.687068Z","elapsedTime":42514,"request":{"domain":"","service":"","identityProvider":"","action":"","attributes":{"User":"{\"userID\":789,\"role\":\"financial advisor\",\"name\":\"Jim Jones\"}","Action":"view","BankAccount.resource":"balance"}},"externallyResolvedAttributes":{},"decision":"DENY","authorised":false,"statements":[{"id":"1290c587-bfdc-434b-b181-43f542207235","name":"Denial reason","code":"denied-reason","payload":"Example: { \"status\": 403, \"message\": \"error_code\", \"detail\":\"Role does not equal teller or customer service rep\"}","obligatory":false,"fulfilled":false,"attributes":{}}],"status":{"code":"OKAY","messages":[],"errors":[]},"attributes":{...},"services":{...},"decisionTree":{...},"evaluationLog":[{...},{...}]} -
In the Policy Editor, go to Policies > Decision Visualiser.
-
In the Paste Logs field, paste the log data you copied in step 1.
-
Click Visualise.
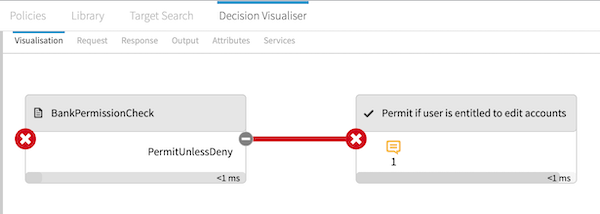
On the Visualisation tab, examine the decision flow to make sure decisions are evaluated according to your expectations.
-
Click a box in the flow to show more details.
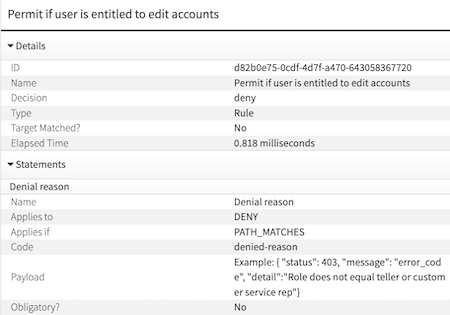
This example represents a rule that denies requests to view account balances if the user’s role is not
tellerorcustomer service repand permits otherwise. The decision evaluated asdenyand took 0.818 milliseconds. Additionally, there is adenied-reasonstatement attached to the decision with additional context for the denial. -
Click the other tabs for additional details:
-
Request tab: Shows the JSON request sent to the decision engine, allowing you to confirm that the expected information was sent.
-
Response tab: Shows the response for the individual permutation’s decision.
This tab includes detailed information about the attributes and policy elements used to produce the decision response.
-
Output tab: Shows the time taken to evaluate each policy set, policy, and rule used in the final decision.
-
Attributes tab: Shows resolution, processing, and policy dependency details for each attribute used in the decision.
-
Services tab: Shows details about the services used in the decision.
-
Policy query logging
The PingAuthorize Server and Policy Editor provide a set of configurable audit logs for debugging policy query requests. Learn more in Policy query logging.