Debugging and analytics
Use these best practices when troubleshooting issues with flows and reviewing flow analytics data.
Review the flow execution log
Open your flow in PingOne DaVinci.
In the lower left corner of the flow editor, click Analytics.
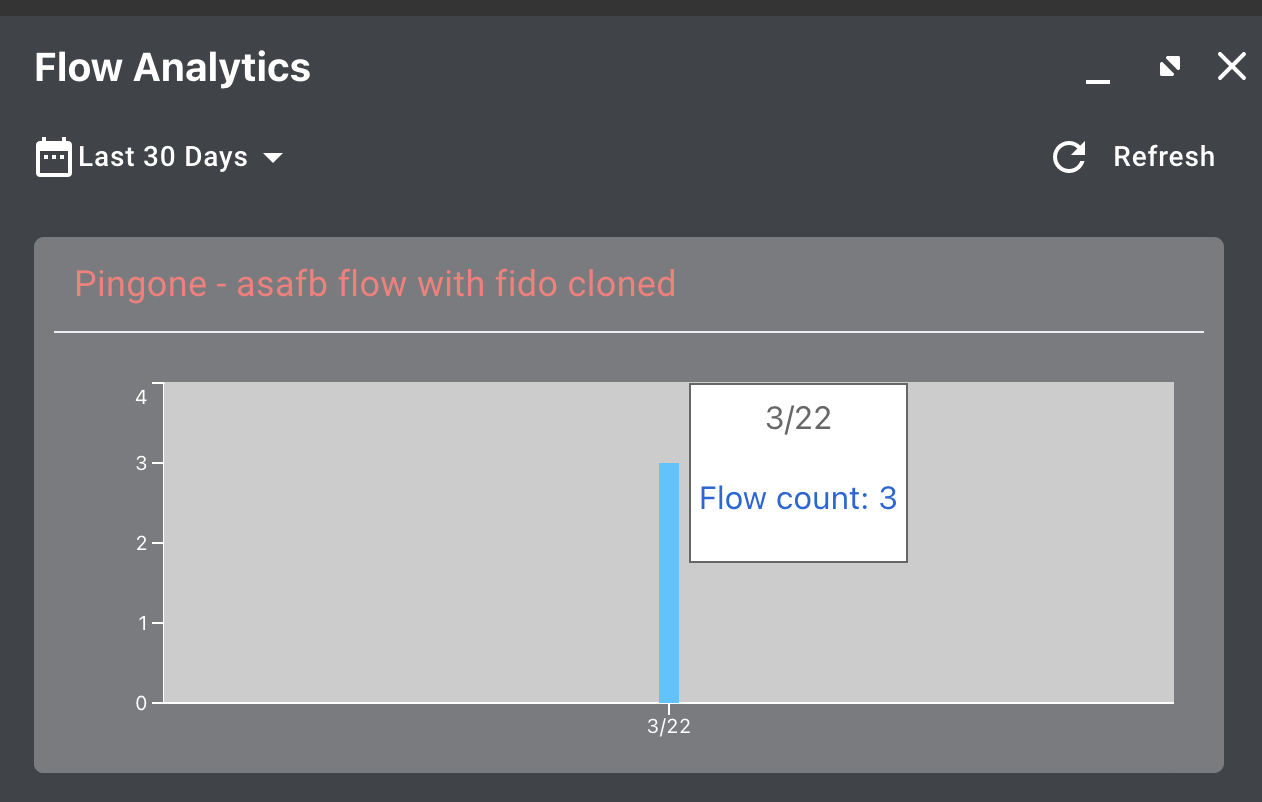
This opens the Flow Analytics window. You can change the date range for the executions of your flow. You can also click Refresh to load information for your latest flow executions.
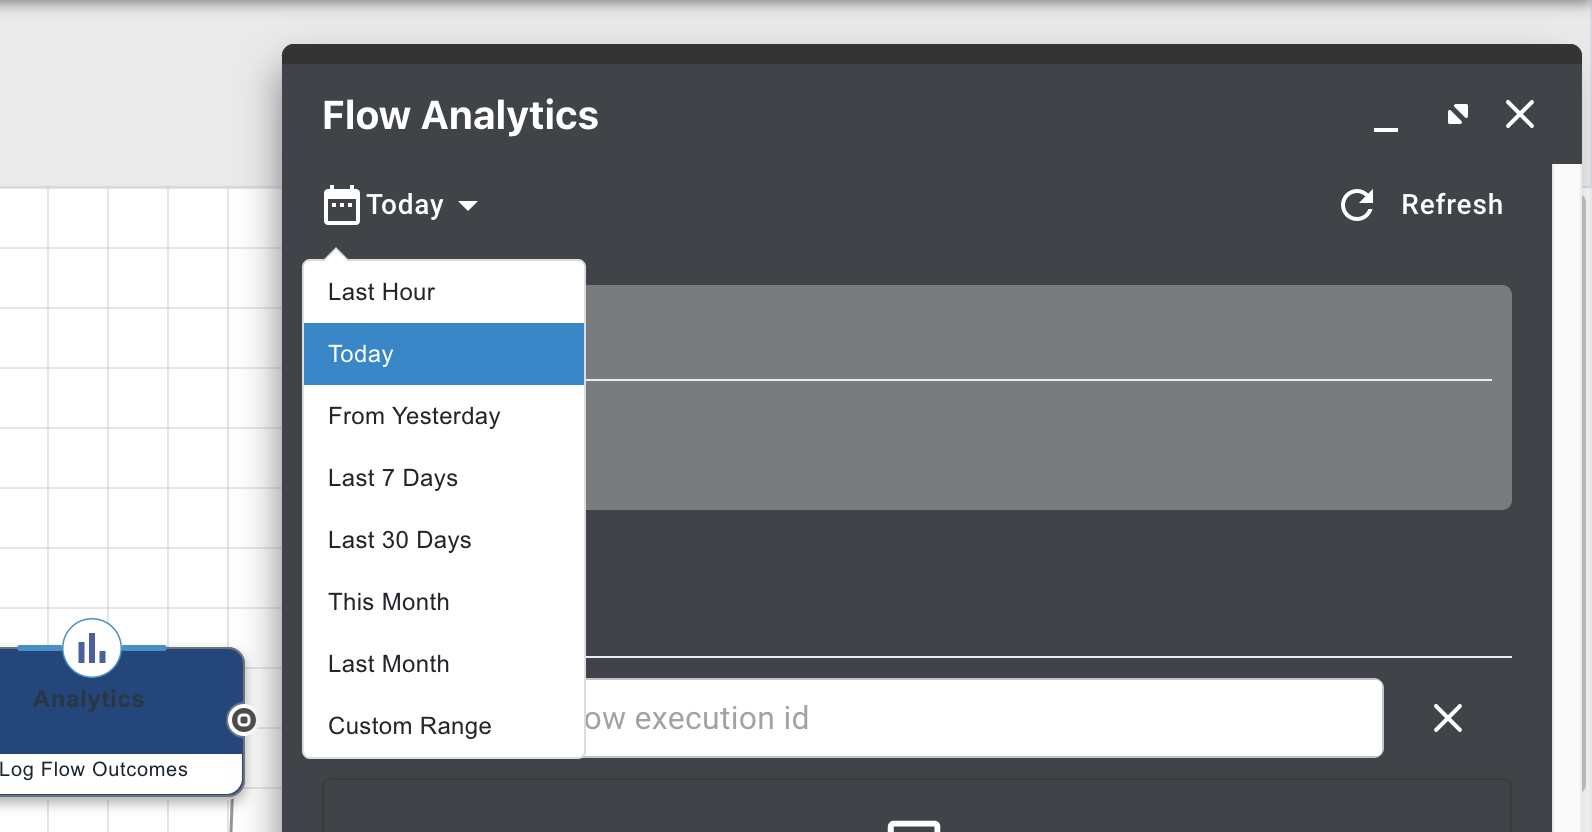
Hover over the graph to see the flow count for the selected timeframe.
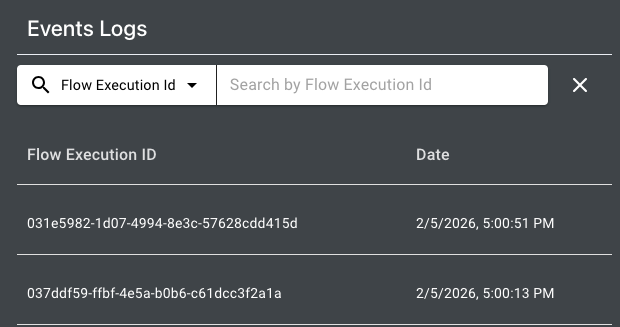
In the Events Logs section, flow executions are displayed in chronological order with the most recent on top. You can search for a specific flow execution using the Flow Execution ID, User ID, User Name, Correlation ID, or Transaction ID. After searching or scrolling to locate a flow execution, you can select it to see its details.
After you select a flow execution, you can see Flow Duration and connector details such as Node Title, Connector, and Capability. Expand the view or scroll to the right to see the Date and Event Message columns. If an error occurred during a node execution, an error icon displays next to the node title. You can mouse-over this icon to display error details, or click any event to highlight the corresponding node.
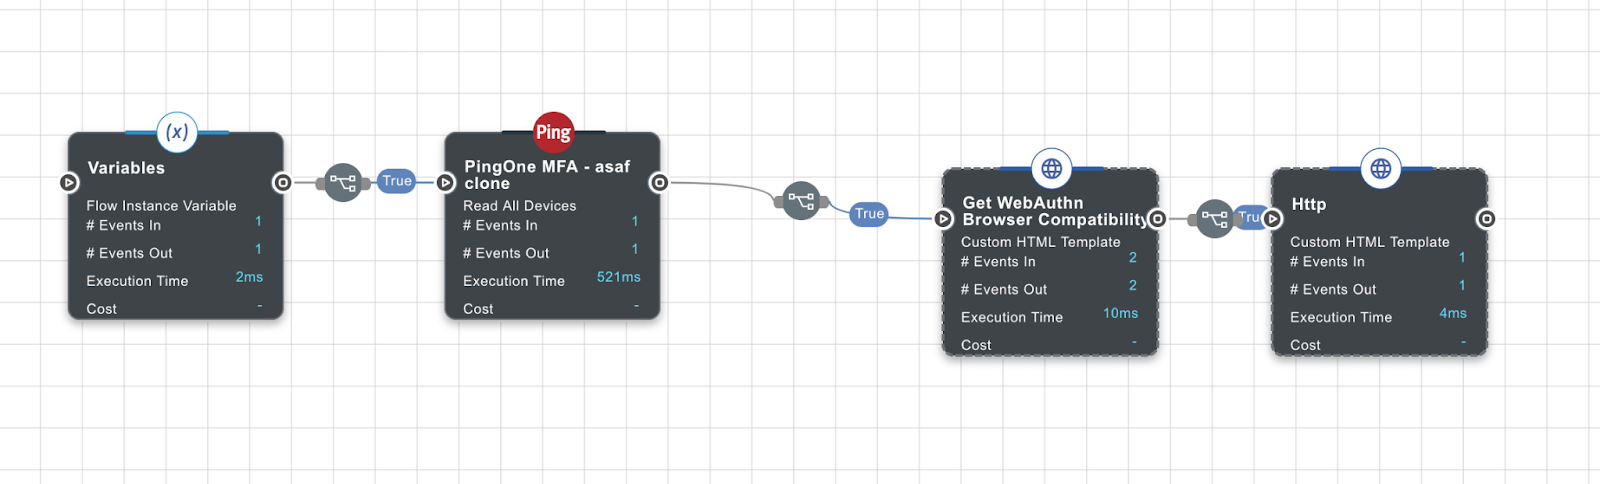
In the canvas view, the nodes show analytic information for the flow execution you selected. Hover over a node to see the related events in the Flow Analytics window.
Click an event in the log to expand the JSON request or response for the event. This allows you to see the information that passed through the flow, including error codes and messages. The types of events included in the analytics depend on the log level of the flow.
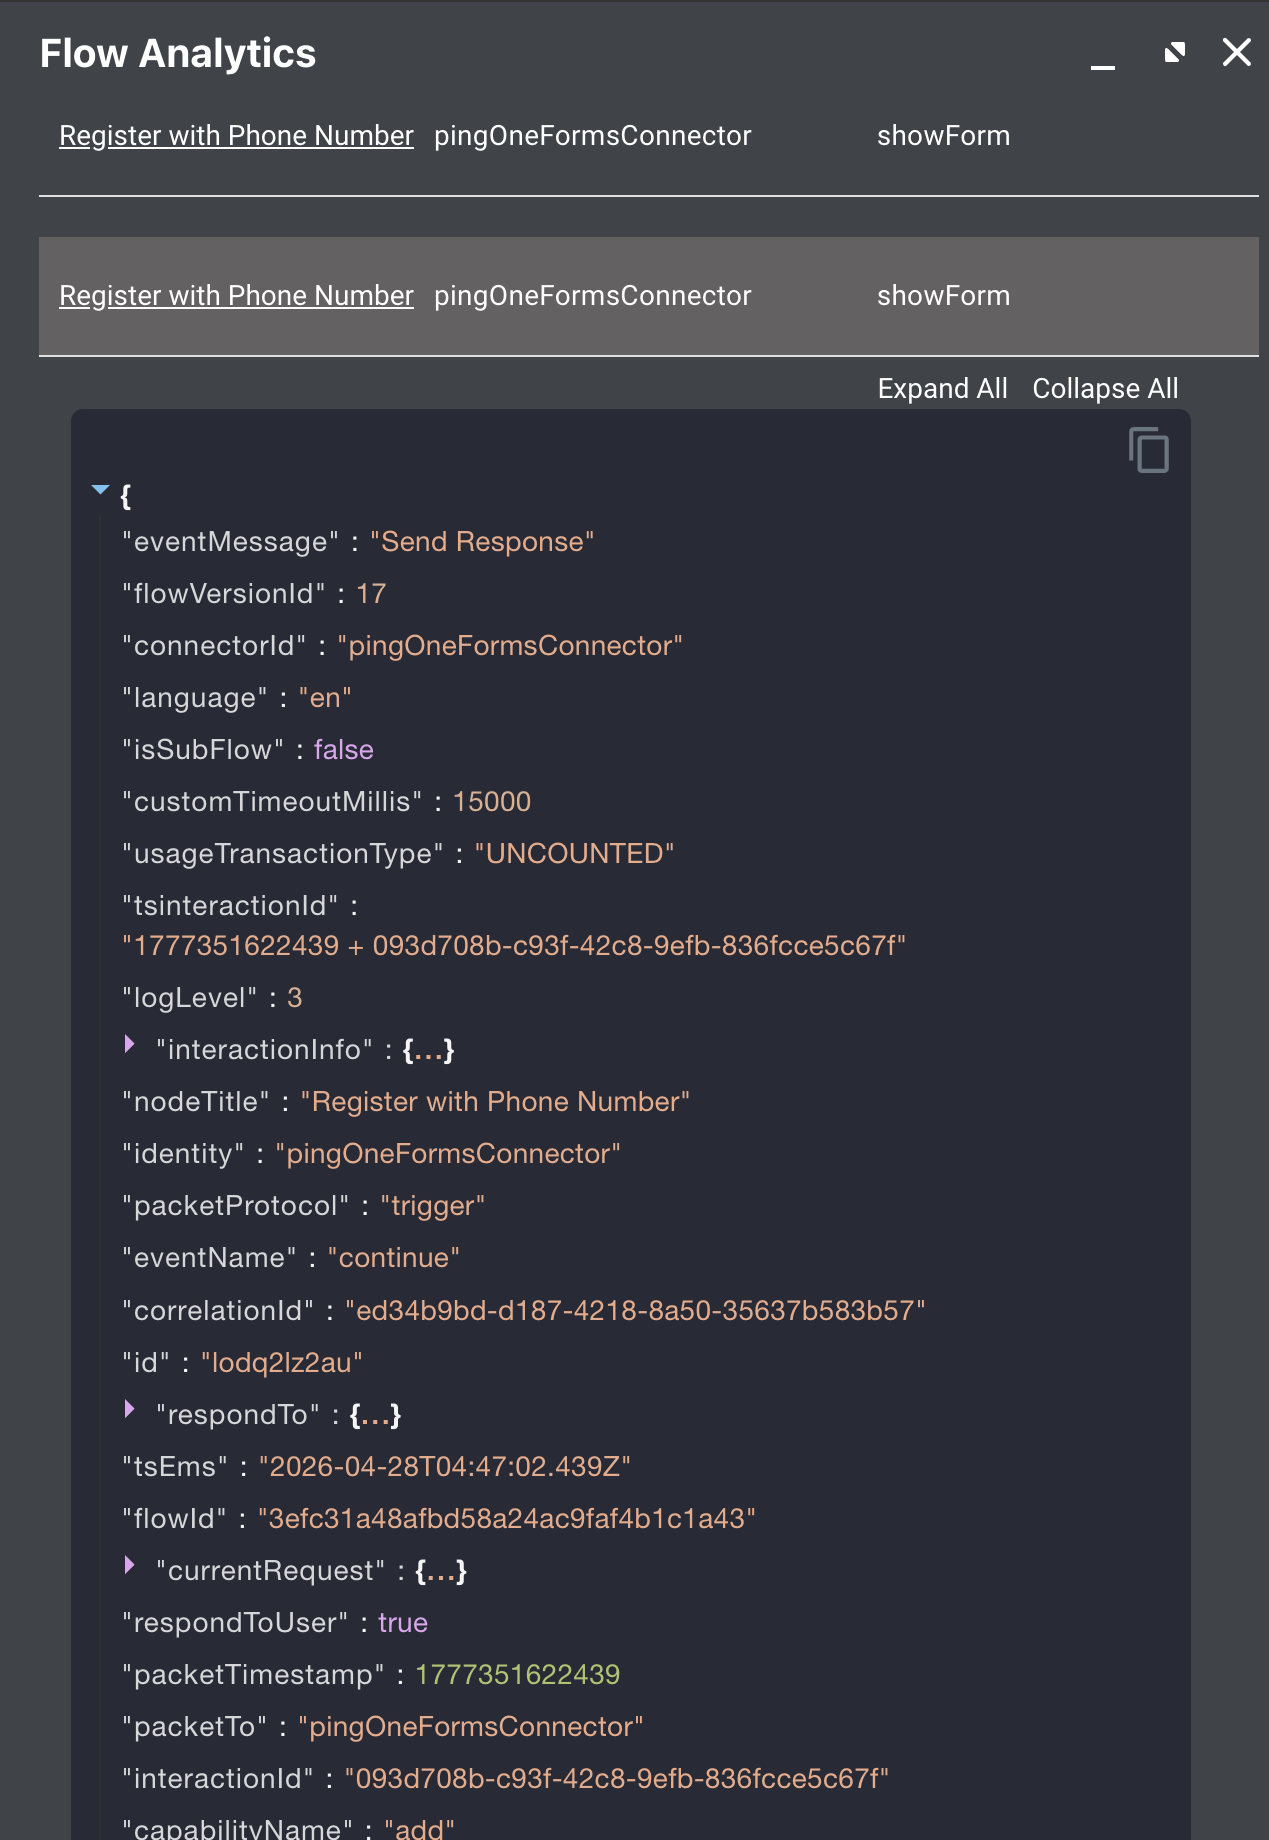
If there are any errors, you might see a Send Error Response that will show you the error encountered.
Use debug mode to view additional details
Use the Debug Mode flow setting to capture additional details in the Flow Analytics log. Enabling debug mode provides additional insight into the properties, parameters, and connector inputs between nodes in the flow.
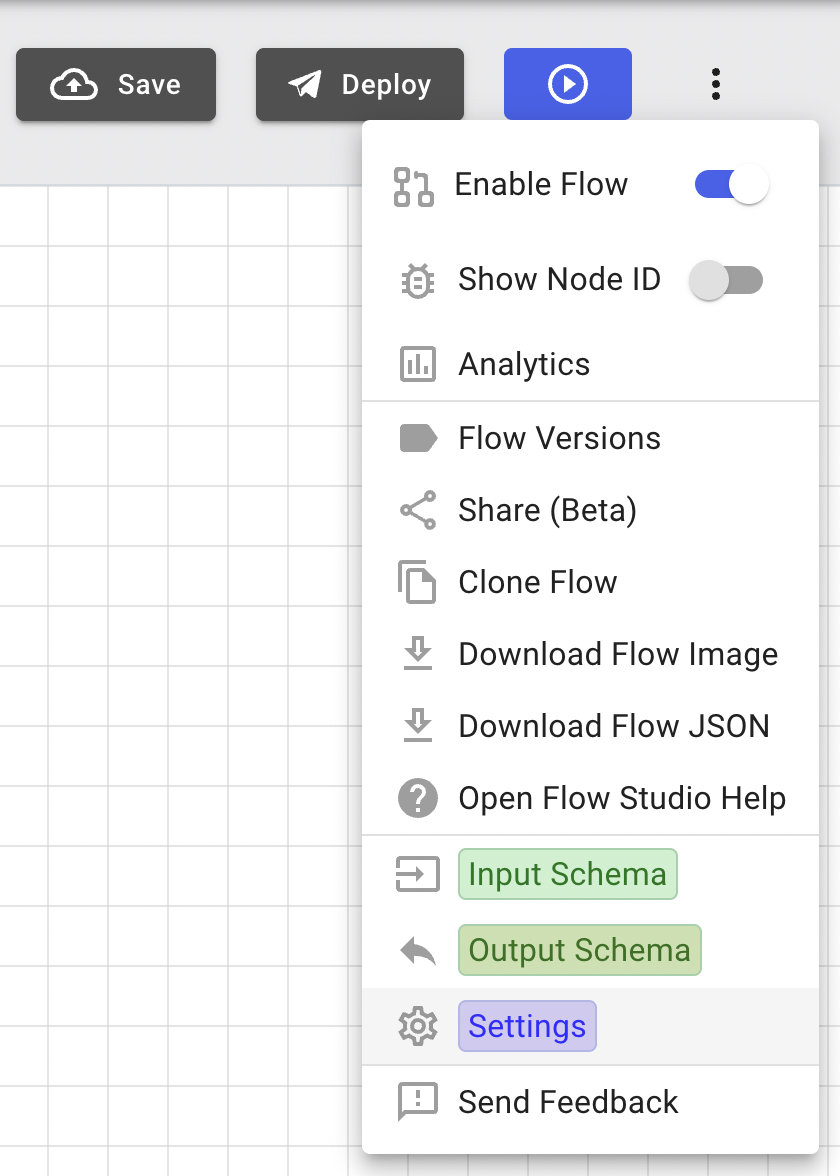
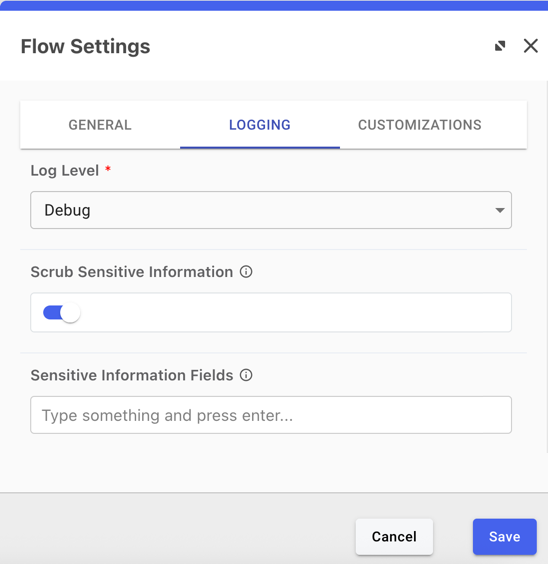
In the upper-right corner of the flow editor, click the More Options ( ) icon and select Flow Settings. On the Logging tab, in the Log Level list, select a logging level. Debug captures the most detailed information.
|
When Debug Mode is selected, the logs can include sensitive data, such as credentials or personal information. |
If the flow could contain sensitive information, use the Scrub Sensitive Information and Sensitive Information Fields options to exclude fields with sensitive information from the logs.
When you are done analyzing the flow, reset the log level to Info to improve performance.
Use Node IDs to track nodes
Turn on node IDs to identify nodes in your flow:
-
Open your flow in PingOne DaVinci.
-
In the upper-right corner of the flow editor, click the More Options ( ) icon and click Show Node ID.
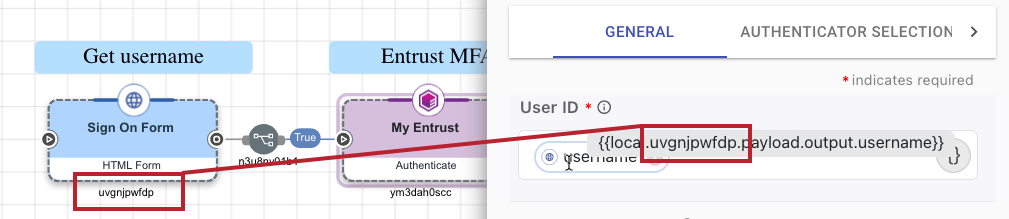
When you use variables to populate capability properties in your flow, you can hover over the variable to see the ID of the node that the variable comes from. With Show Node ID enabled, you can check the source of the variable to make sure it’s correct.
|
Always make sure your variables point to the expected node ID after you copy or clone nodes or flows. |
Review API responses
Learning how to read API responses is also useful for troubleshooting in PingOne DaVinci.
If you scroll to the top of an event, you can review the properties of the API call and the schema for the connector.
Use the Error Message connector
The Error Message connector allows you to display custom error messages in a DaVinci flow and is useful for handling errors consistently in a production flow.
For debugging a test flow, use the HTTP connector with the Custom HTML Message capability to capture and display errors.
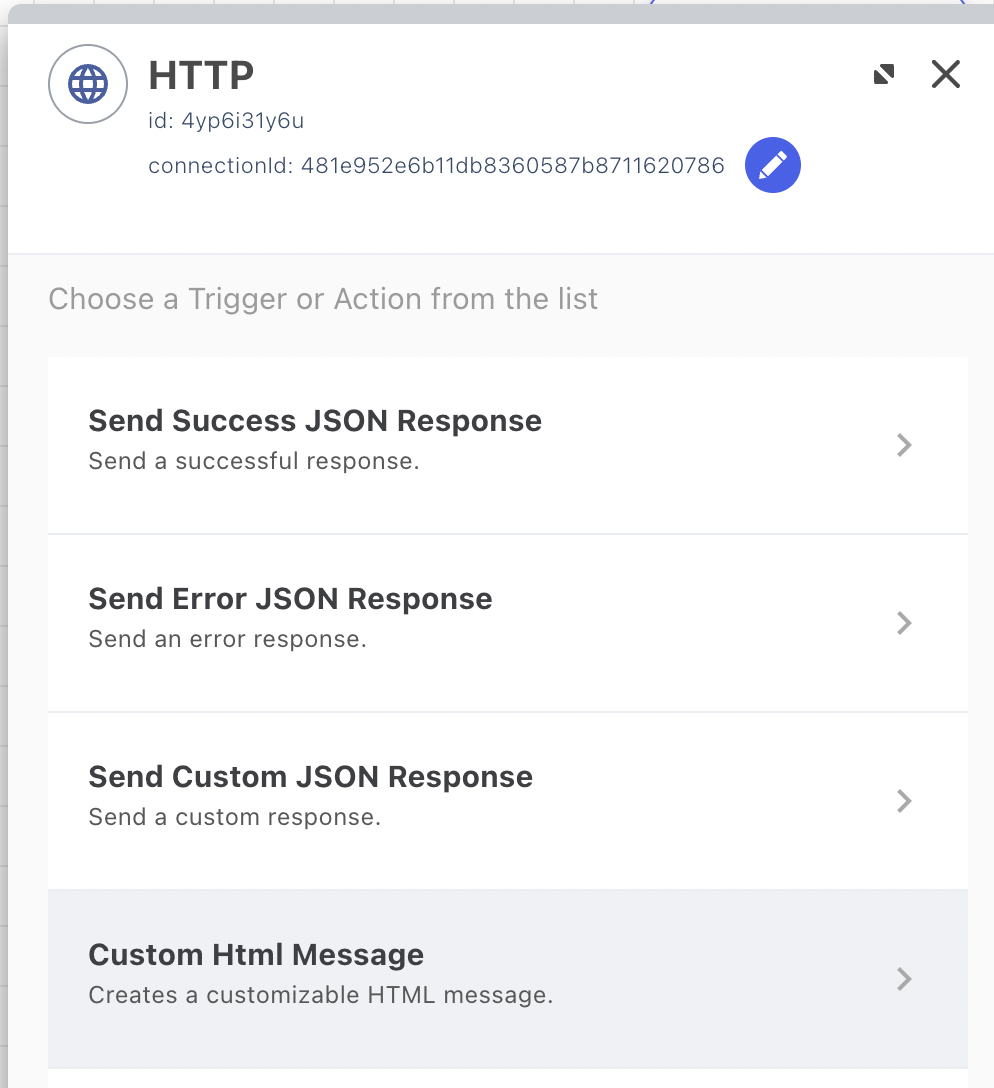
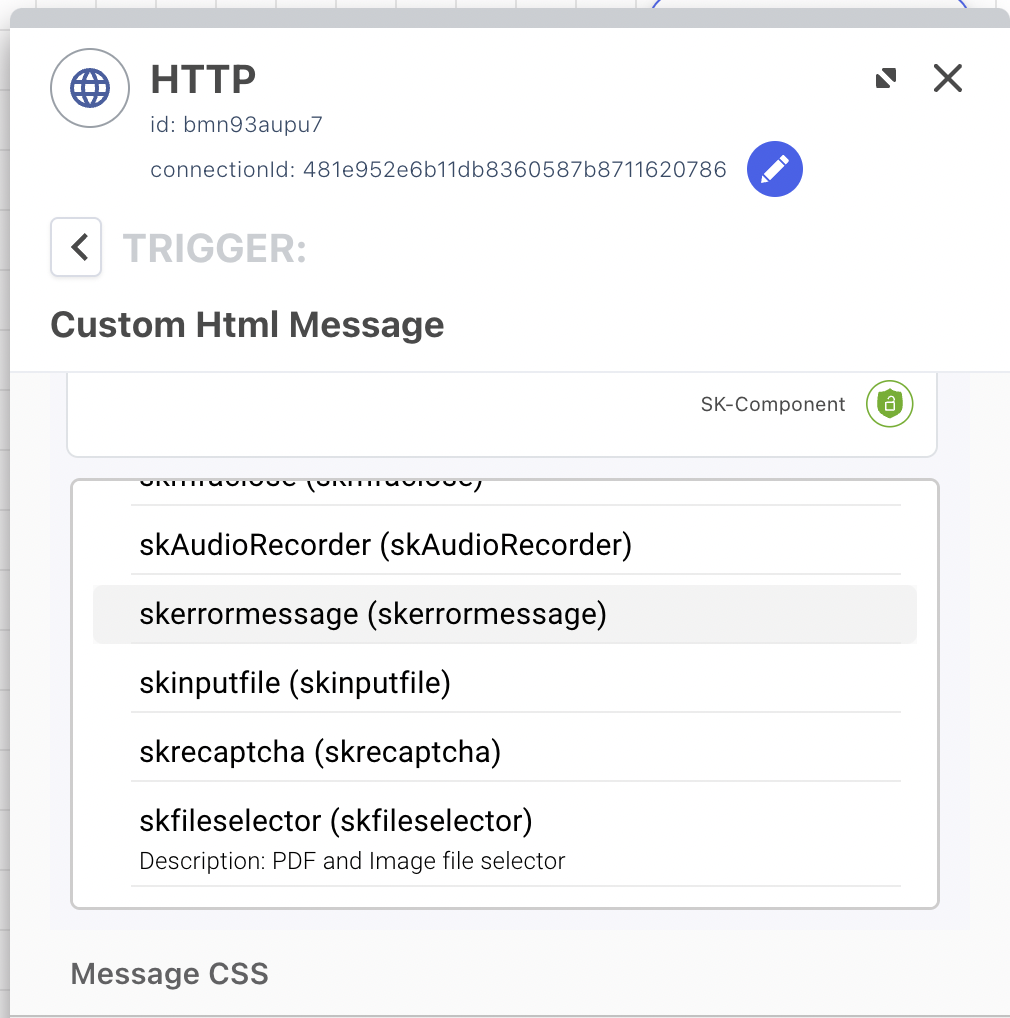
When using the HTTP connector, use the skerrormessage SK-component to capture and show DaVinci-specific error information.
There are two ways to display the skerrormessage.
Use a basic message:
-
In your flow, add an HTTP connector and select the Custom HTML Message capability. Select the node on the canvas.
-
In the Message field, click {} and select the skerrormessage variable from the SK-Component source.
Use a custom HTML template:
-
In your flow, add an HTTP connector and select the Custom HTML Template capability. Select the node on the canvas.
-
In the Message field, click {} and select the skerrormessage variable from the SK-Component source.
For example, if you want to capture the skerrormessage on a password validation, HTML similar to the following may be used:
<div id="password-validation-message"
  class="errormsg feedback--error sk-alert sk-alert-danger has-text-danger has-background-danger-light text-center"
  style="color:red" data-skcomponent="skerrormessage" data-skerrorid="password">
</div>
<div data-skcomponent="skerror"
  class="feedback feedback--error sk-alert sk-alert-danger has-text-danger has-background-danger-light text-center"
  style="color:red" data-id="feedback" data-skvisibility="">
</div>
Send flow data to an external analytics tool
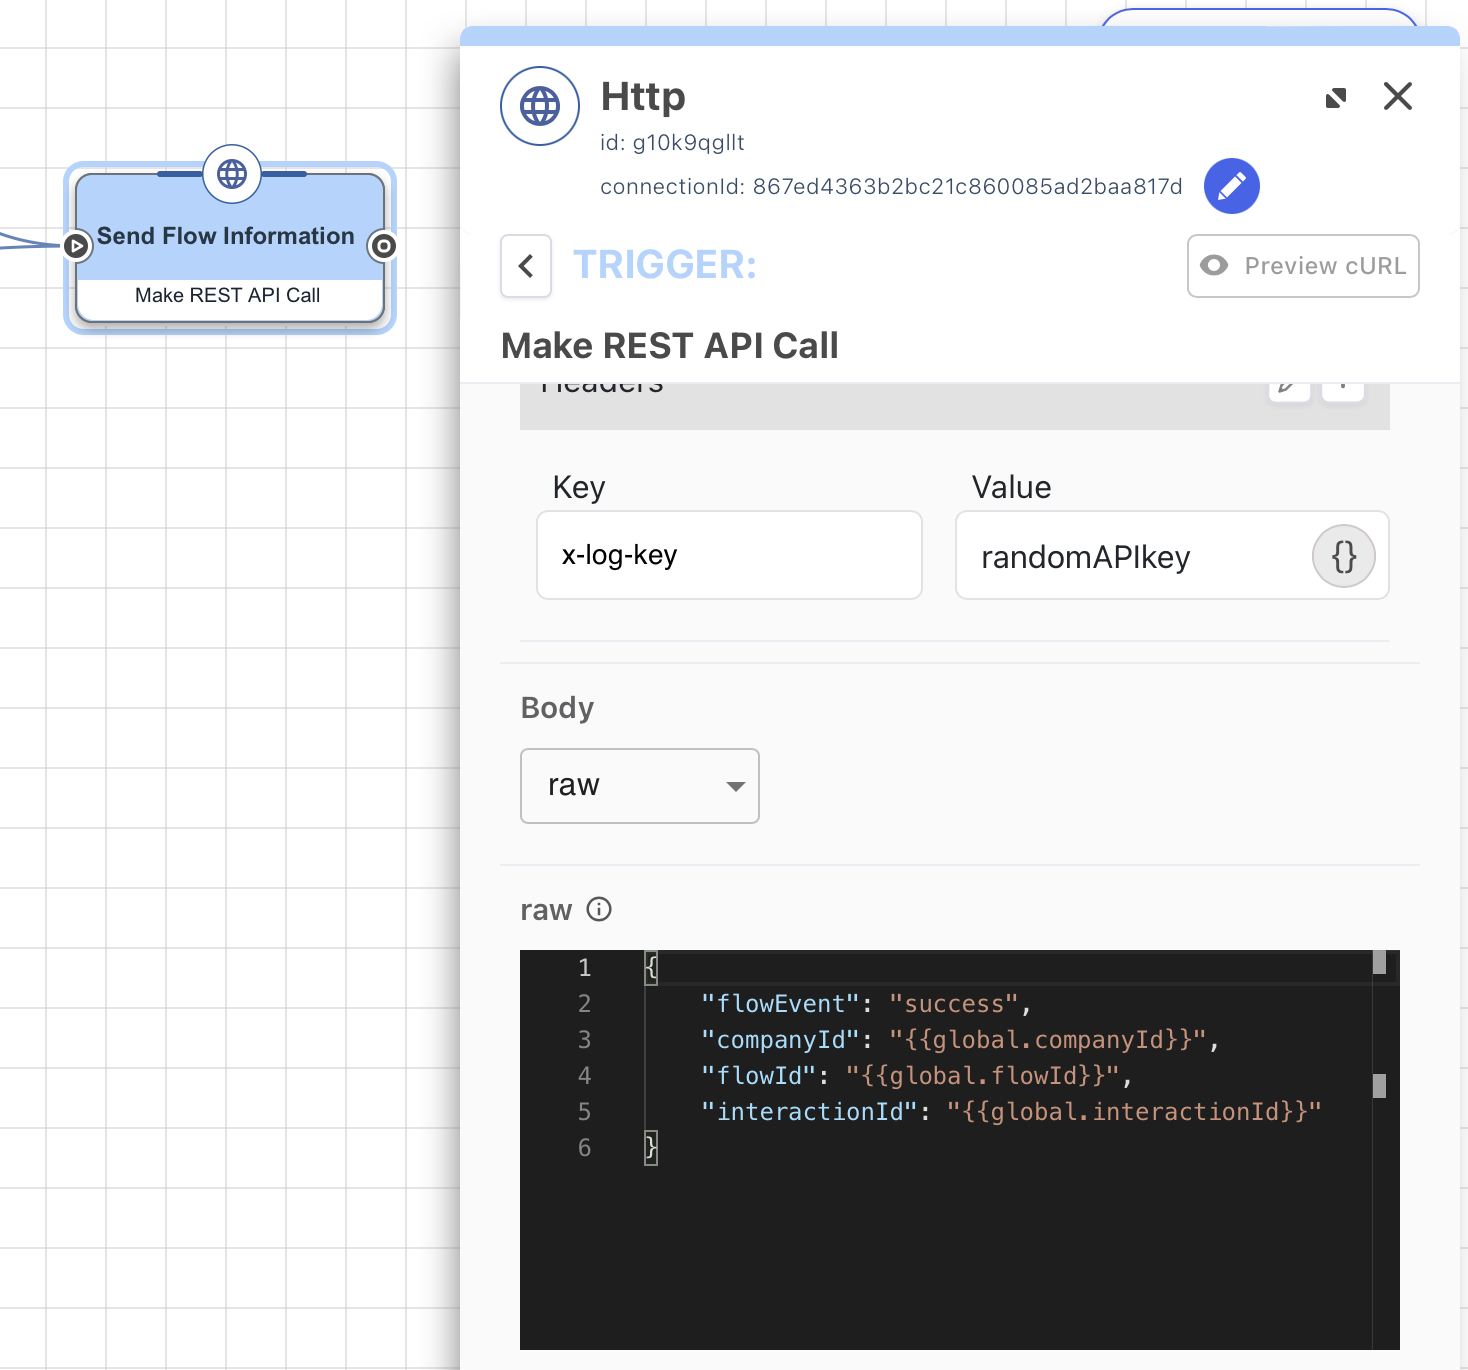
You can use the HTTP connector’s Make REST API Call capability to send DaVinci log data to an external log aggregator or analytics tool.
-
In your flow, add an HTTP connector and select the Make REST API Call capability. Select the node on the canvas.
-
In the Headers section, click the Add (+) icon.
-
In the Key field, enter
x-log-key. -
In the Value field, enter the API key.
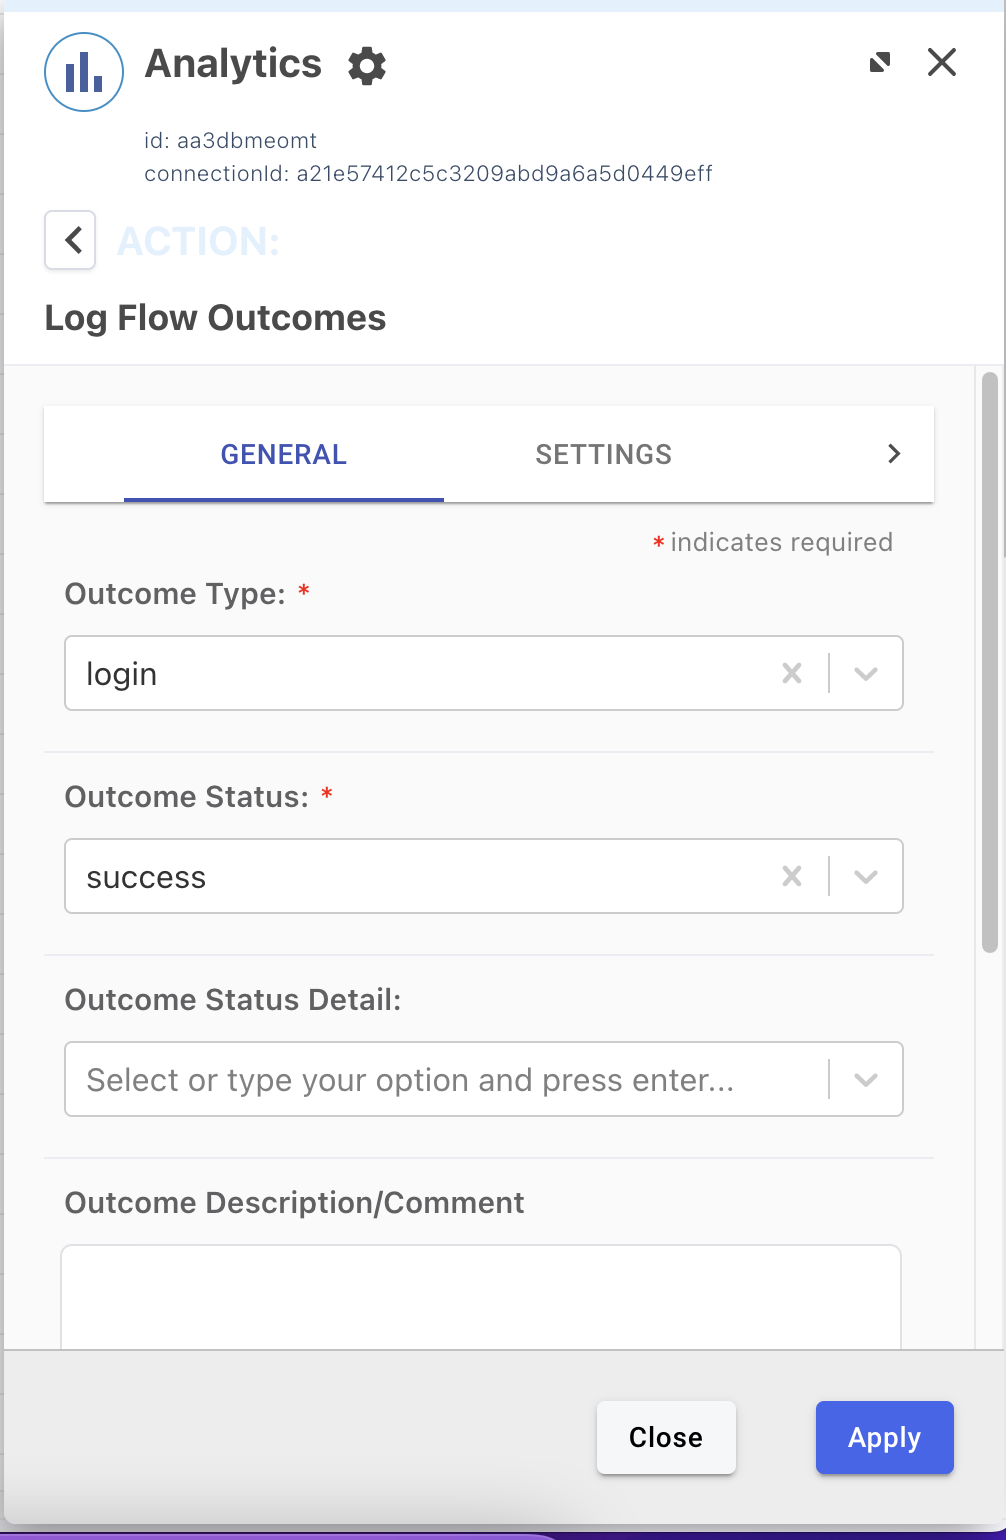
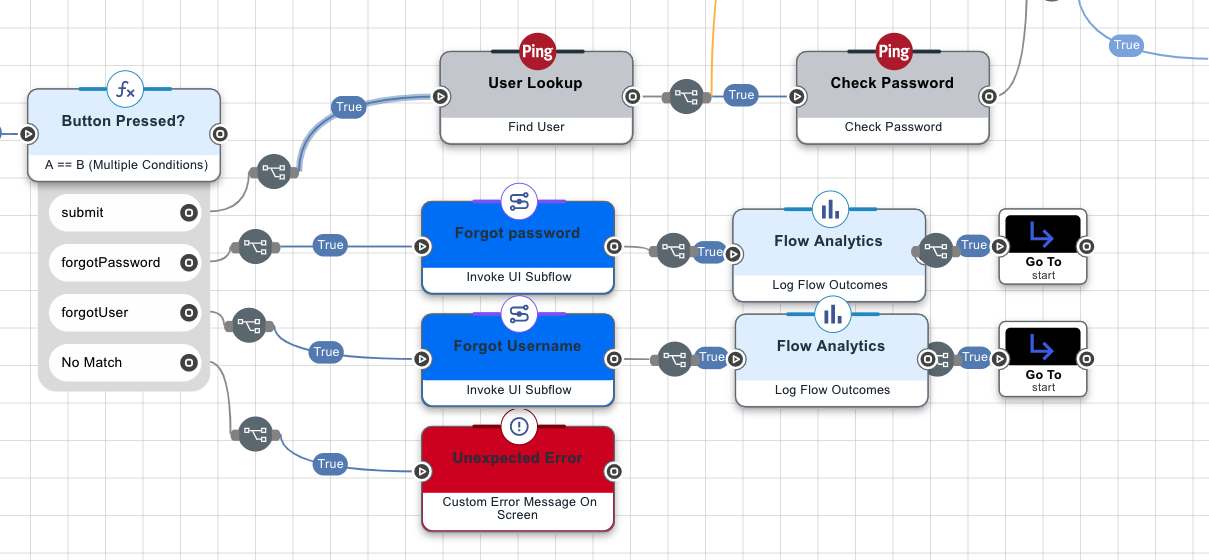
Add the Flow Analytics connector to the flow
The Flow Analytics connector enhances the standard analytics view with cumulative results. Use the Flow Analytics connector in key places in your flow to collect the information that’s most important to you.
Correlate information using available IDs
Multiple ID values display in the analytics and in webhook events at all logging levels. You can use these IDs to correlate events between products and gain a clearer understanding of issues you encounter.
| Identifier | Description | Purpose |
|---|---|---|
|
A |
Lets you trace a specific HTTP request execution within PingOne that spans multiple PingOne microservices. |
|
A For example, if a PingOne flow is initiated from the OAuth authorization endpoint, the |
Used to trace a flow execution across all PingOne services. |
|
A For example, flows executed as part of PingFederate integration are assigned an |
Used to trace the flow execution across all PingOne and external services when an external system is involved. |
|
A |
Used to trace user sessions across flow executions. |
|
An |
Used to trace user sessions across flow executions and external applications. |