Monitoring and logging
With PingOne Advanced Services, your organization has its own dedicated cloud network that you can define, without having to manage cloud resources, containers, networking, scaling, healing, and backup and restoration.
Our Support team and the Site Reliability Engineers proactively monitor your infrastructure and deployments and attempt to address issues before they become problems. If outages occur, we’ll notify you using standard support methods.
To help you monitor your Ping Identity applications and configurations, you can use either the built-in log aggregation tool, OpenSearch, or stream the log files yourself using Generic HTTP, Webhook, or Splunk HTTP Event Collector (HEC).
You can also subscribe to receive alerts from PingOne Advanced Services, which will notify you of events occurring within your network. Learn more in Subscribe to SNS alerts.
Learn more:
Platform monitoring
The PingOne Advanced Services platform is built on AWS, so we leverage their tools to monitor and support the platform.
These tools include:
-
Amazon CloudWatch, which is used for real-time monitoring of the AWS platform and our applications leveraging the platform.
-
GuardDuty, which is used for intelligent threat detection.
We also use New Relic, an observability platform used to log, track, and analyze data from any digital source in real time.
You are not responsible for monitoring the platform or its infrastructure, so you won’t see any of the alerts sent from these services, but rest assured that we will notify you if your network is affected.
You can also access the Ping Identity status page to see service interruption information, or subscribe to receive alerts regarding particular products or services.
Application monitoring and alerts
To help you monitor the health of your network, you can subscribe to SNS alerts. Learn more in Subscribe to SNS alerts.
Some of the most common PingFederate alerts and PingDirectory alerts are listed and described here.
You can also use Grafana to monitor your applications using interactive dashboards with charts and graphs. Information is pulled from the PingFederate, PingAccess, and PingDirectory, application endpoints, and displayed in the dashboards. Learn more about these dashboards in Using Grafana to monitor your applications.
PingFederate alerts
If more than one error occurs within one minute, alerts will be sent to those who subscribe to them. Alerts that PingFederate administrators often subscribe to include:
| Error alerts | Description |
|---|---|
Fatal or critical errors |
These errors were not discovered by other filters and likely require immediate attention. |
Connectivity errors |
These errors can occur for a variety of reasons and often indicate that cluster members cannot communicate with components, either within or outside of PingOne Advanced Services, or with each other. PingFederate connectivity alerts are:
|
Authentication flow errors |
These errors indicate that the authentication flow contains errors, which are often HandleAuthNRequest errors. PingFederate authentication flow alerts are:
|
Invalid action errors |
These errors indicate that a large number of unexpected invalid calls or actions were detected. The PingFederate invalid action error is:
|
Decoding errors |
These errors indicate that a large number of token decoding errors were detected. The PingFederate decoding error is:
|
PingDirectory alerts
If more than one error occurs within one minute, alerts will be sent to those who subscribe to them. Alerts that PingDirectory administrators often subscribe to include:
| Error alerts | Description |
|---|---|
Fatal or critical errors |
These errors were not discovered by other filters and likely require immediate attention. The PingDirectory critical error is:
|
General errors |
These errors indicate that issues within the application might negatively affect the user experience. PingDirectory general alerts are:
|
Connectivity errors |
These errors can occur for a variety of reasons and often indicate that cluster members cannot communicate with components, either within or outside of PingOne Advanced Services, or with each other. The PingDirectory connectivity error is:
|
Replication errors |
These errors indicate that data consistency issues exist. PingDirectory replication alerts are:
|
Performance errors |
These errors indicate that performance has fluctuated more than it normally does. The PingDirectory performance alert is:
|
Garbage collection errors |
These errors indicate that garbage collection processes are occurring more frequently, or are taking longer than expected. The PingDirectory garbage collection filter alert is:
|
Using Grafana to monitor your applications
Use Grafana to monitor the health of your applications using interactive charts and graphs.
| Grafana pulls data from two different sources: OpenSearch retains data for 30 days, and Prometheus retains data for 15 days. |
Learn more:
Signing on to Grafana
To sign on to Grafana:
-
Access the following URL:
https://monitoring.<environment>-<stub>.<region>.ping.cloud/docsFor example, if your services are deployed in us1 and eu1, and us1 is your primary region, and your environment stub is "hot-coffee", you use this URL to access your production logs:
https://monitoring.prod-hot-coffee.us1.ping.cloud/ -
Enter your username and password in the appropriate fields and click Sign On.
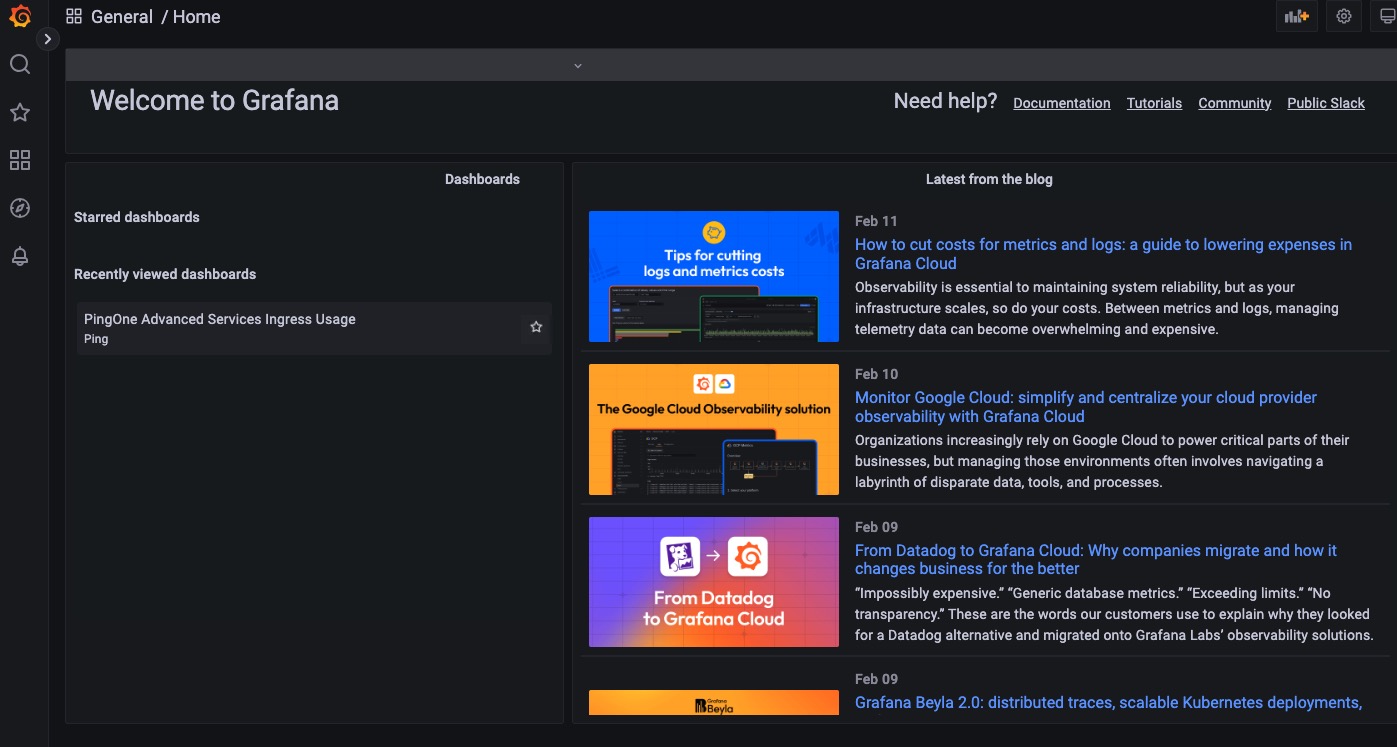
The Grafana homepage displays.
Accessing dashboards for Ping Identity products
To access the Ping Identity product dashboards:
-
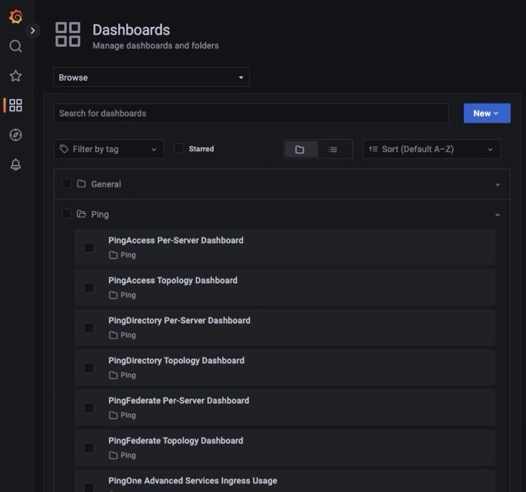
Select the Dashboards menu and click Browse.
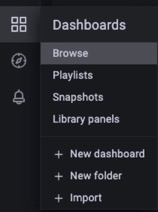
A list of dashboards available for each product displays.
-
Select a dashboard.
-
The Topology dashboards display data that is aggregated across multiple servers.
-
The Per-Server dashboards display data on a per-server basis.
-
The Ingress Usage page displays standard dashboards for the ingress proxies that sit in front of the Ping Identity products to handle incoming traffic and enhance security.
The Ingress metrics are currently incorrect in scale and don’t reflect the actual response times seen at Nginx. Use the PingFederate or PingAccess response times.
-
Using dashboard charts
To use the charts displayed on the dashboard, you can:
-
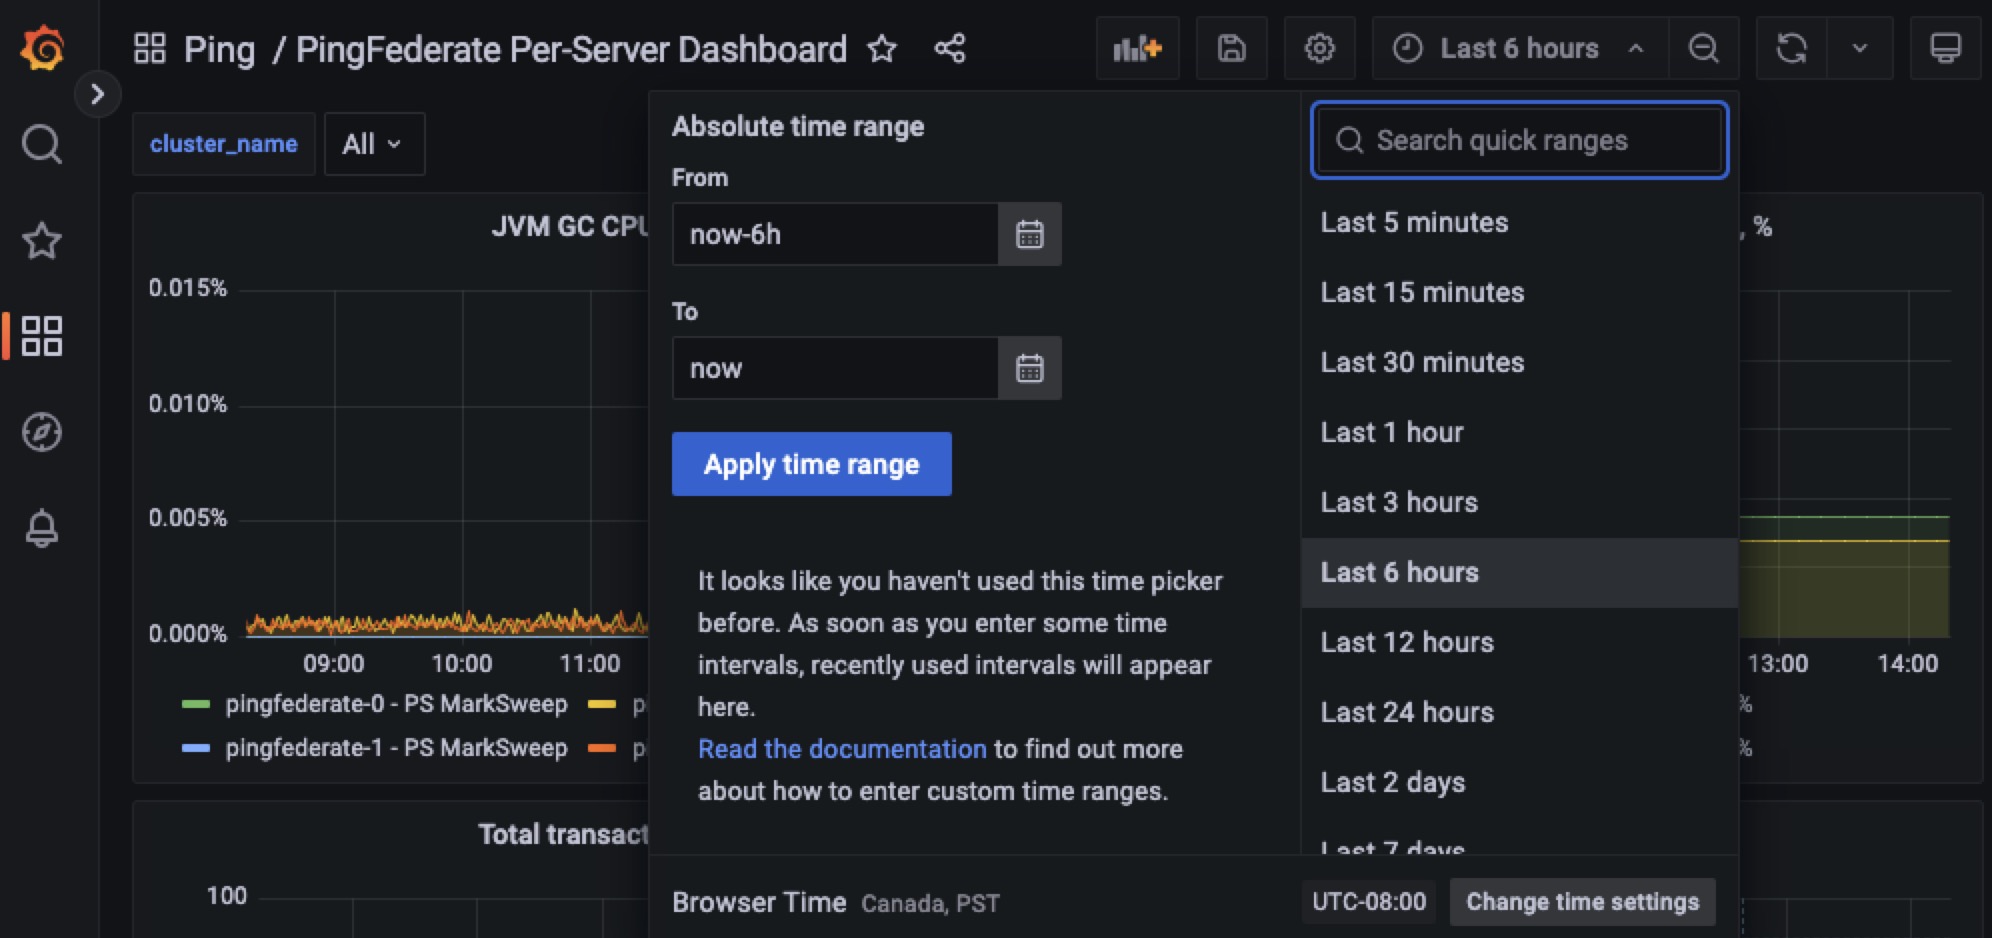
Specify the time period for which you want to view data.
The last six hours are displayed by default. Ensure that Grafana is set to your time zone.
-
Click directly in the chart to drill down and review specific metrics.
Using Explore to locate specific metrics
Additional metrics are available using Explore.
-
Select the Explore menu.
-
Select Prometheus as the source at the top of the page.
-
Click in the Metric field and enter the name of the product for which you want metrics.
For example, if you want to see metrics for PingFederate, start typing
PingFederate, and the list displays metrics for PingFederate, as shown here.
-
To review the response times for a specific data store, select it from the list and click Run Query.
To look for external services that are impacting PingFederate performance, enter PingFederate_dataStores*,PingFederate_connections*, orPingFederate_adapters*in the Metrics field.
Logging
Event logs contain valuable information regarding possible security threats, outages, and metrics that can help troubleshoot issues.
You can either use the built-in log aggregation tool, OpenSearch, or you can stream the log files yourself using Amazon S3 Bucket, Generic HTTP or Webhook, IBM QRadar, Splunk HTTP Event Collector (HEC), or Syslog.
Using OpenSearch
PingOne Advanced Services has built-in log aggregation. Standard logs from Ping Identity products are streamed to OpenSearch, where you can review the data in a variety of different dashboards.
-
Go to
https://logs.<env>-<stub>.<primary-region>.ping.cloudto access OpenSearch. -
Click Log in with single sign-on.
-
On the Select your tenant page, select Global and click Confirm.
The OpenSearch Dashboards modal opens.
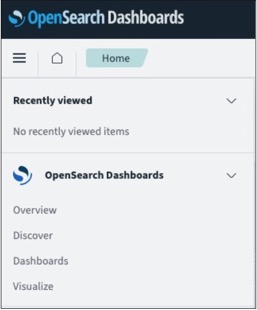
-
Expand the OpenSearch Dashboards list select the appropriate application:
-
Discover gives you access to data from each Ping Identity product log. You can analyze your data by querying and filtering, viewing results, and drilling down to examine specific documents. You can also create histograms to display your data. Learn more about Discover in Using the Discover application in the OpenSearch documentation.
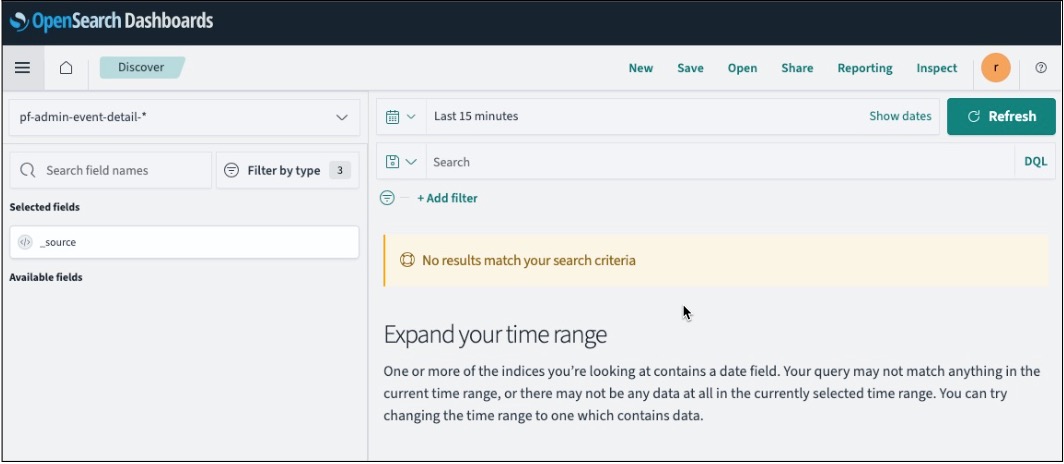
-
Dashboards provides you with pre-built dashboard templates for PingOne Advanced Services, which allow you to visualize your data. Learn more about Using the Dashboards application in the OpenSearch documentation.
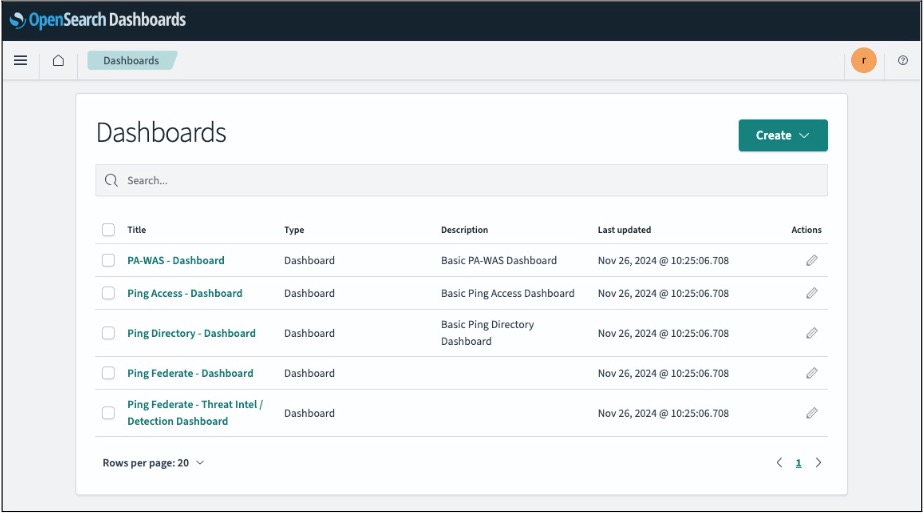
-
Streaming log files
You can stream your log files near real-time for all Ping Identity products in your PingOne Advanced Services cloud network using one of the log aggregation tools listed here.
You can either set up this process when you initially access your applications or submit a service request at any time. In your request, make sure that you include the pertinent information listed here regarding your aggregation tool.
Refer to the following for details about each logging tool:
Generic HTTP or Webhook
To export log files with a generic HTTP or webhooks, include the following information in your request:
-
Endpoint URL
-
HTTP method used to send data
-
An authorization token or key (optional)
Splunk HTTP Event Collector (HEC)
Splunk HEC only supports RAW Endpoint. To export log files, include the following information in your request:
-
Splunk HEC Endpoint URL
-
Splunk API Key
If you want to use a logging tool not listed, reach out to your account team.
Product-specific logs
Detailed information regarding product log files is available in the product documentation:
PingFederate:
PingDirectory:
PingAccess:
Updating your log-streaming services
In the July 2022 release, PingOne Advanced Services added a configurable log-streaming pipeline, which made it possible to customize the ways log data is streamed. You can filter streamed data by application, log, and keywords, and modify JSON files.
If you have not yet migrated to the new streaming processes, be aware that streaming formatting changes need to occur and are outlined here. This format is based on logstash output filters and can be customized to meet your needs.
Here is an example of a log event at the input:
{"@timestamp":"2022-07-14T12:00:10.728763Z",
"message":"All pods in namespace ingress-nginx-public are running              |
PASS |\n",
"log_type":"customer_out",
"time":"2022-07-14T12:00:04.314969694Z",
"kubernetes":
{"container_hash":"public.ecr.aws/r2h3l6e4/pingcloud-services/robot-framework@sh
a256:e64b3beb9c23d655f8542e685f0c68c01178498f4b226294f36773832dd1cb48",
"container_image":"public.ecr.aws/r2h3l6e4/pingcloud-services/robot-framework:v1
.3.0",
"docker_id":"9944534ac7556566a40a9f40331e5d07b0cf4244cca2a5a07e6f4b83d0de69a9",
"labels":
{
"app":"ping-cloud",
"controller-uid":"ea007809-075f-4cd6-9955-ad69c94ae190",
"job-name":"healthcheck-cluster-health-27630000"
},
"container_name":"healthcheck-cluster-health",
"host":"ip-10-254-1-222.us-west-2.compute.internal",
"pod_id":"05dc5c68-852e-40f9-93a8-13a24502d545",
"namespace_name":"ping-cloud-antonklyba",
"pod_name":"healthcheck-cluster-health-27630000-4fztv"},
"host":"10.254.12.248",
"@version":"1",
"stream":"stdout",
"log_group":"application"
}
This file contains the following information:
-
@timestamp: Indicates when logstash processed the event.
-
log or message: Ping Identity applications generate logs and all other types of applications and sidecars.
-
log_type: Provides internal labels for all events sent to the pipeline.
-
time: Date and time when the log was captured, which could be different from the date and time it was generated.
-
kubernetes: The nested JSON object with kubernetes metadata.
-
host: The internal IP address of a fluent-bit pod sent to logstash.
-
@version: This internal logstash field will always be “1”.
-
stream: The name of the stream where the log was captured, and will either be stdout (standard output) or stderr (standard error).
-
log_group: This internal label will always be “application”.
If you do not apply filters and opt to use the default output configuration, a variety of differences exist:
-
If you are exporting log files with Amazon CloudWatch or generic HTTP, you will receive a JSON file similar to the example.
-
If you are exporting log files to an Amazon S3 Bucket:
-
Ensure that the S3 output is appropriately configured. Use
‘codec
							⇒ “json”’
to create a JSON file similar to the example. The S3 output is useless when filters are not applied or this setting is not established because it only obtains @timestamp, host, and message fields from the event. -
By default, the following line will be written to text files named
'ls.s3.${randomUUID}.${currentTime}.${tags}.${part}.txt`${timestamp} ${host} ${message}(e.g “2022-07-14T12:00:04.314969694Z 10.254.12.248 All pods in namespace ingress-nginx-private are running | PASS |”)Filenames within S3 buckets can be prefixed to create directories, but the filenames are hardcoded and cannot be changed.
-
-
If you are exporting log files to Syslog, it uses the rfc3164 format, by default:
${timestamp} ${host} ${process}: ${message} (e.g. “Jul 14 12:00:04 10.254.12.248 LOGSTASH[-]: All pods in namespace ingress-nginx-private are running |PASS |”)Ensure that Syslog output is appropriately configured. Either use
‘codec ⇒ “json”’to send the whole JSON object in a ${message} field, or configure the message property to include specific fields.