IoAs (Indicators of Attack)
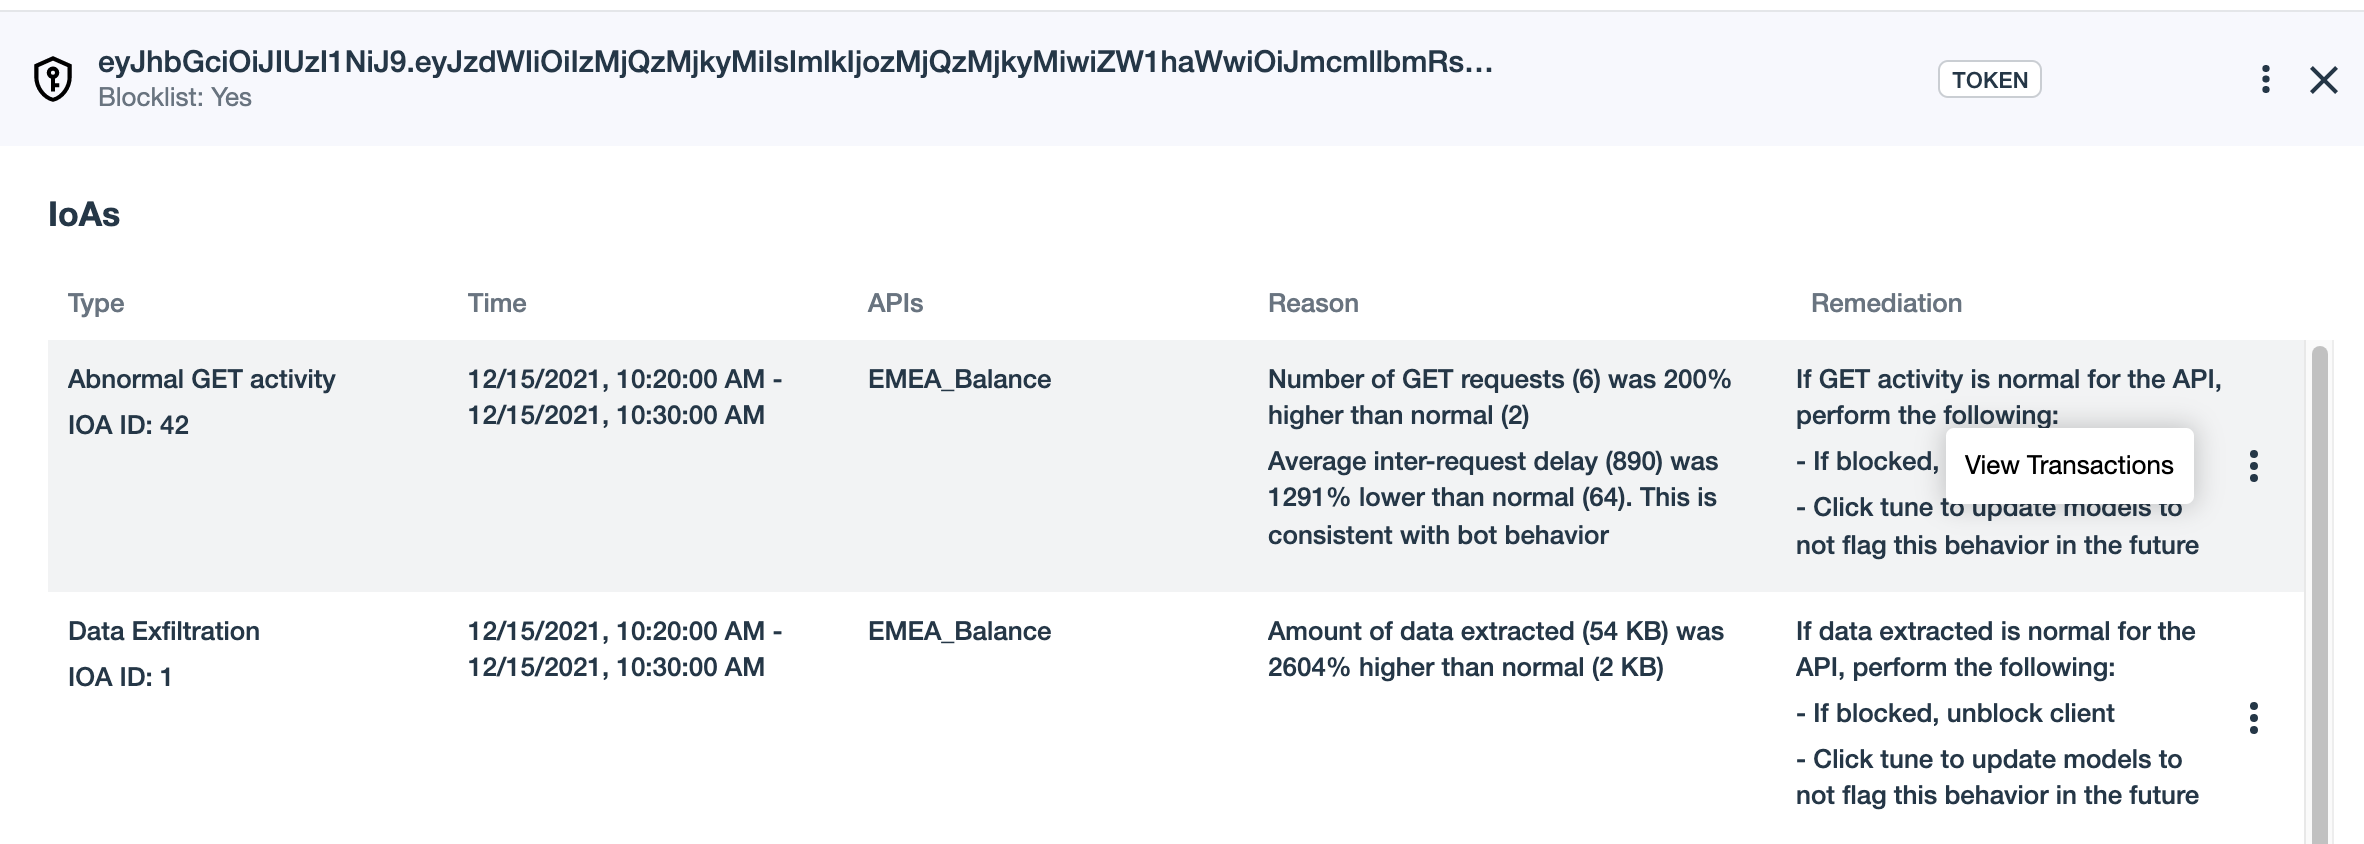
The IoAs (Indicators of Attack) dashboard lists the detected IoAs for a client row int the Attack list table of the Attack management dashboard. The IoAs dashboard provides some high-level details, and functionality for further drill downs, inspection and analysis of the client’s activities during the reported period.
Go to Attack management.
Click on a client row in the Attack list table, to navigate to the client’s IoAs dashboard, for further drill downs, inspection and analysis of the client’s activities during the reported period. The IoAs dashboard lists detected IoAs.

| Column | Description |
|---|---|
Type |
Type of IoA |
Time |
Starting and ending date and time of the abnormal activity |
APIs |
The name of the impacted API |
Reason |
The rationale behind generating the IoA |
Remediation |
Suggestions for handling the reported IoA |
Three-dot drop down |
Click View transactions to navigate to the Transactions screen, for details on each transaction that generated the IoA on the API |
Actions and drill downs
- Actions
-
On the right side of the row in the main Attack management list, or at the top right of the IoAs dashboard, click the three-dots drop down to choose an action option:
-
Client activity: Navigate to the Client activity dashboard, for further inspection and analysis of the client’s activities during the reported period.
-
Tune IoA detection: Select this option to update models to not flag this behavior in the future.
-
Remove from blocklist: Select this option to update models to remove this entry from the blocklist.
-
- Drill down
-
View transactions: To view the list of transactions that generated the IoA, click the three-dot drop down on the right of the IoA row, and then click View transactions. The View transactions dashboard provides functionality for further drill downs, inspection and analysis of the client’s activities during the reported period.
Click X in the top right to return to the previous dashboard.