Stream logs to an external monitoring tool
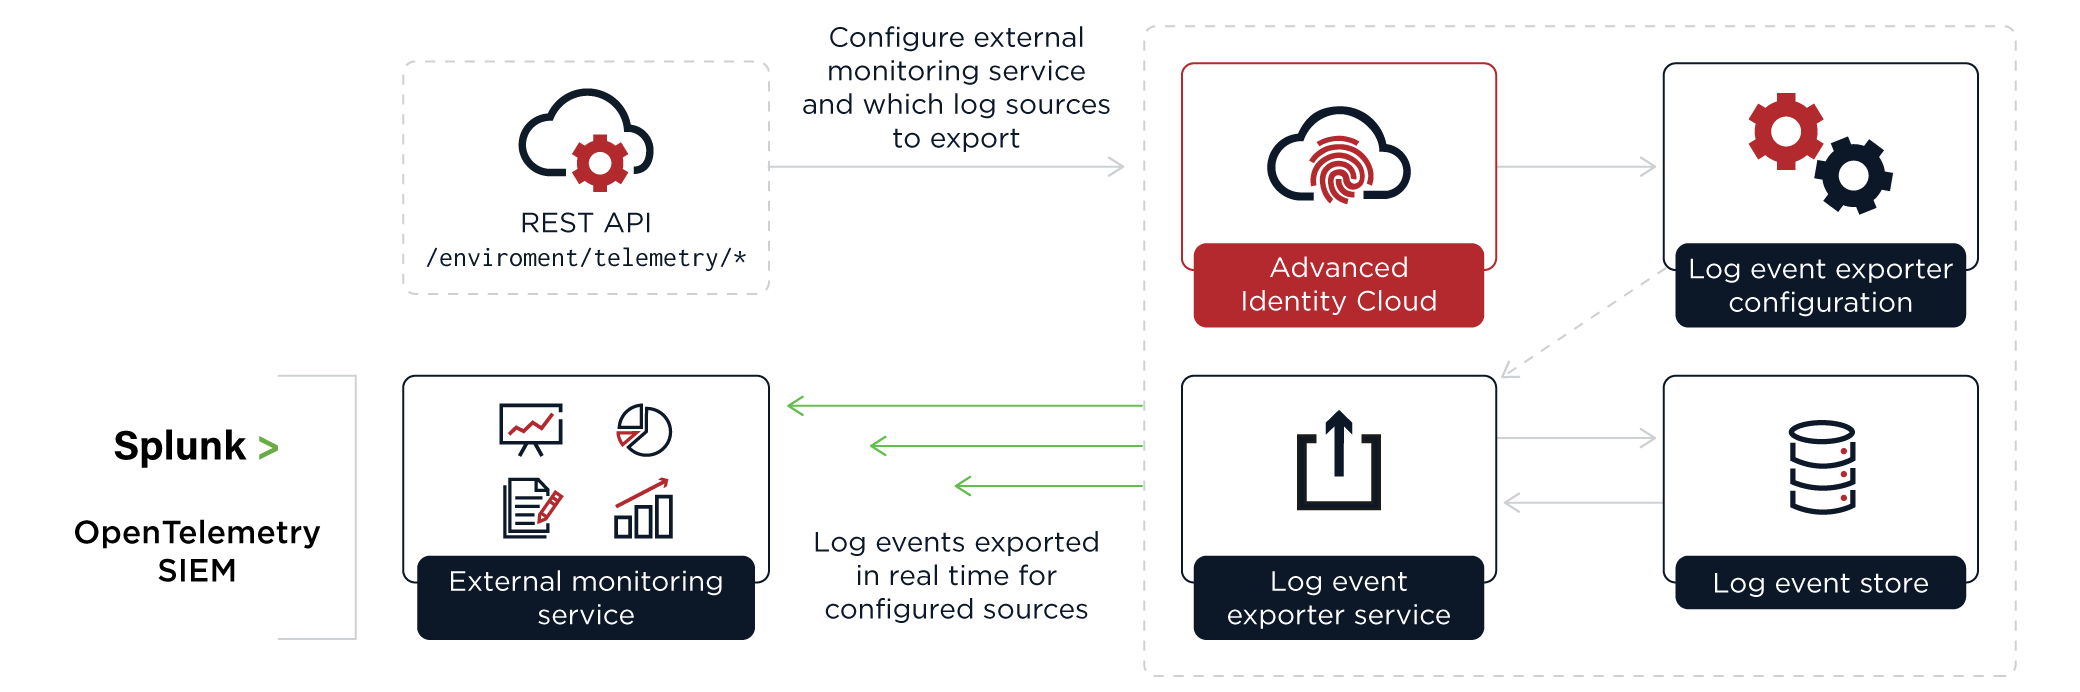
You can stream Advanced Identity Cloud logs to an external monitoring tool, a process sometimes known as push logging. This lets you monitor certain events in real time and troubleshoot issues using your preferred SIEM or event monitoring solution, such as Splunk or an OpenTelemetry-compatible SIEM like Grafana Cloud, Datadog, or New Relic.
Advanced Identity Cloud supports streaming log data in OpenTelemetry Protocol (OTLP) and Splunk formats.
To configure a log-streaming service, use REST API calls to define the telemetry format, the log sources to stream, and the destination monitoring tool. Advanced Identity Cloud’s log-streaming service then retrieves the logs and sends them to your chosen monitoring tool in real time.
| An Advanced Identity Cloud tenant environment can have only one log-streaming service configuration. This means you can only send logs to one external monitoring tool or SIEM. |
Use cases
Streaming Advanced Identity Cloud logs to an external monitoring tool in real time has many use cases, including:
-
Debug journeys while viewing real-time events and errors.
-
Monitor the performance of authentications during journey creation.
-
Collect events from Advanced Identity Cloud and enrich them with data from other sources.
-
Detect and respond to critical events. For example, a sudden spike in registrations might mean an effective marketing program or suspicious activity.
-
Set alerts on authentication and registration requests from particular regions.
-
Monitor the improper use of APIs.
-
Monitor user activity, success/failure rates, and password reset requests.
Supported formats
The log-streaming service supports the following formats:
-
-
HTTP transport:
-
gRPC over TLS:
-
-
Splunk
-
HTTP transport:
-
HTTP header with Splunk token required (example)
-
Set up a log-streaming service
Follow these steps to set up a log-streaming service:
-
Determine the Advanced Identity Cloud log sources to stream.
-
Configure your destination monitoring service to receive log events from Advanced Identity Cloud.
Refer to your monitoring tool vendor documentation for configuration details.
- Grafana
-
-
Go to your Grafana Cloud Stacks page.
-
Under OpenTelemetry, click Configure.
-
Copy the OTLP Endpoint, adding
/v1/logsto the end. For example,https://example.grafana.net/otlp/v1/logs. -
Copy the
Instance IDfor the username. -
Under Password / API Token, click Generate Now to generate the password.
-
- Datadog
-
-
Follow the Datadog documentation to get
DD_API_KEYandYOUR_ENDPOINT. The value inYOUR_ENDPOINTmust end in/v1/logs.
-
- New Relic
-
-
Follow the New relic documentation to get
OTEL_EXPORTER_OTLP_ENDPOINTand yourapi-key. The endpoint must end in/v1/logs.
-
- Splunk
-
-
Configure HTTP Event Collector (HEC).
-
Make a note of the HEC token. You’ll need this when you configure log streaming in Advanced Identity Cloud.
You must disable indexer acknowledgment for the HEC token. The Advanced Identity Cloud log-streaming service isn’t compatible with this feature.
-
-
Configure the log-streaming service in Advanced Identity Cloud using the REST API. Learn more in Manage log streaming using the API.
-
Verify that the log events are arriving at the external monitoring tool correctly.