Viewing transactions
Steps
-
Go to Attack management.
-
Click on a client row in the Attack list table, to navigate to the IoAs (Indicators of Attack) dashboard, that lists detected IoAs for the client.
-
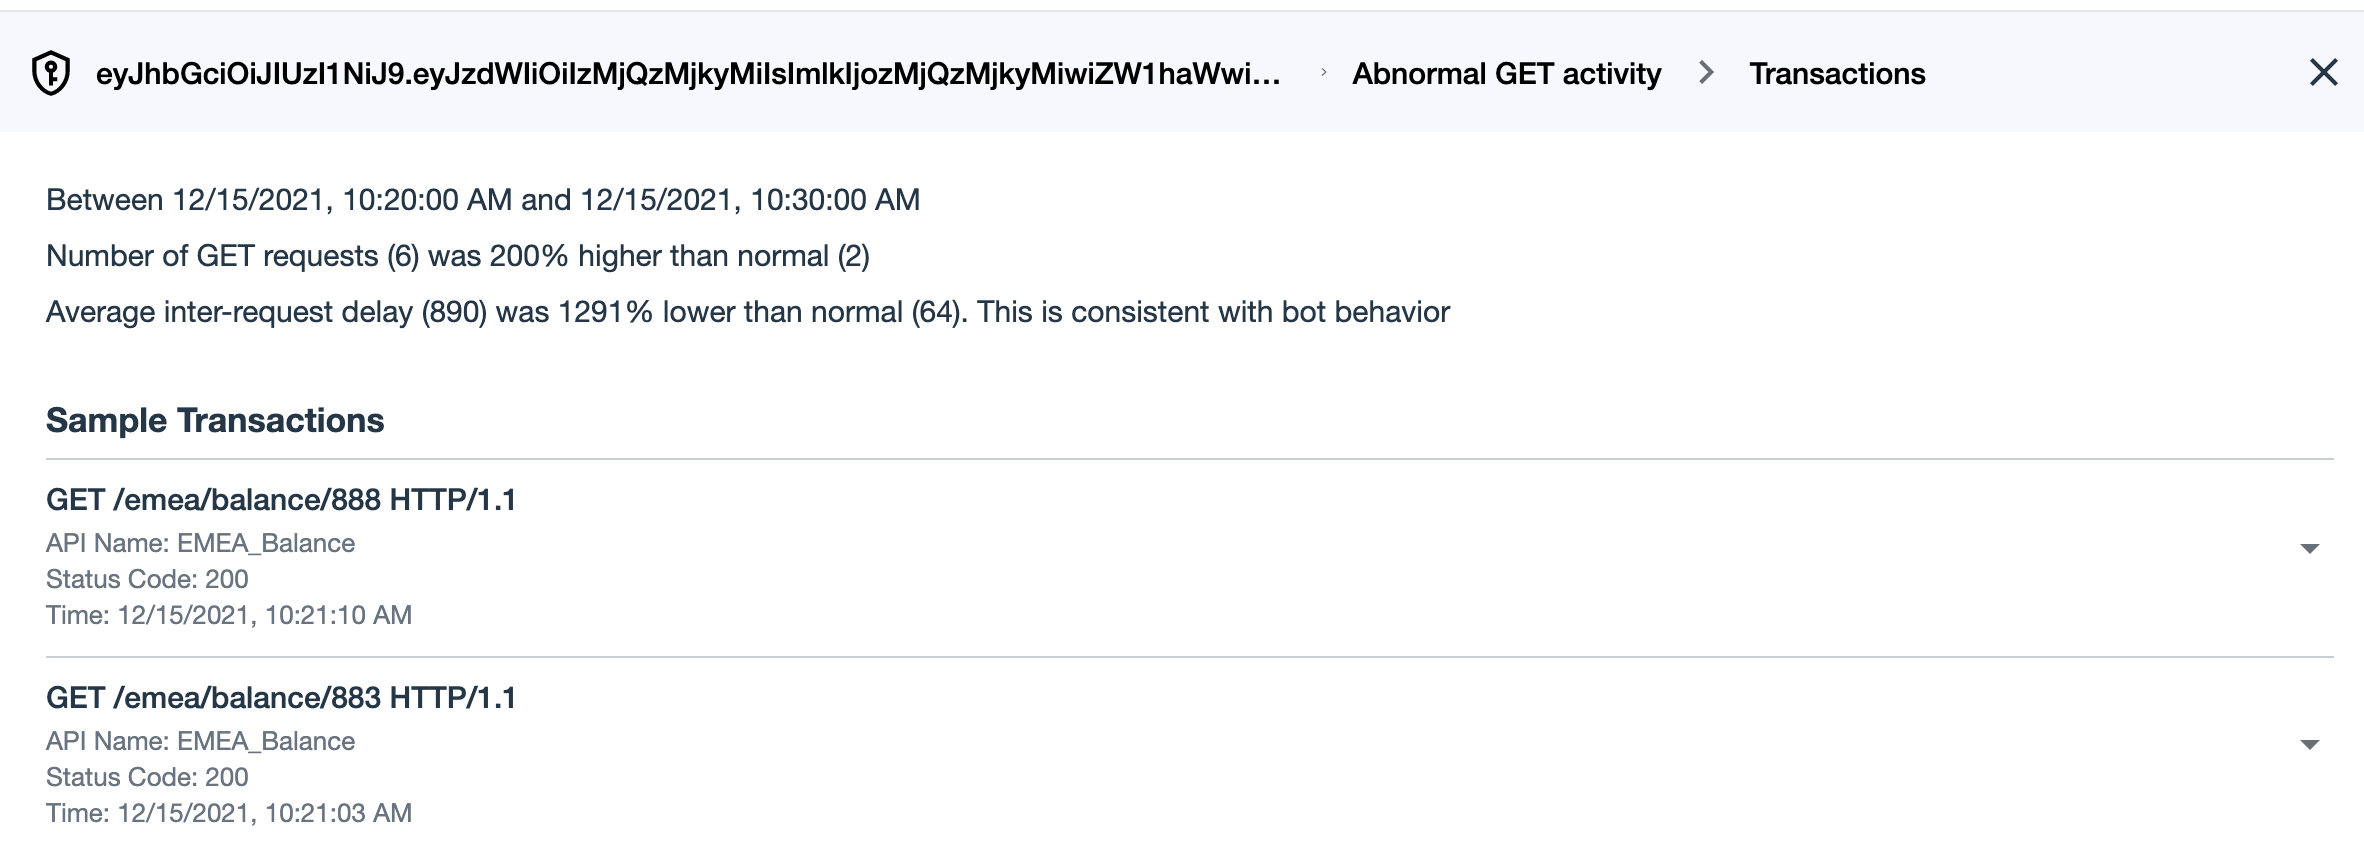
To view the list of transactions that generated the IoA on an IoA’s row, click the three-dot drop down on the right, and then click View transactions.
The list of transactions appears with one of the headings:
-
Transactions: The list displays all the transactions involved in the IOA detection. -
Sample Transactions: When the number of transactions is large, the list displays a sampling of the transactions involved in the IOA detection.

-
-
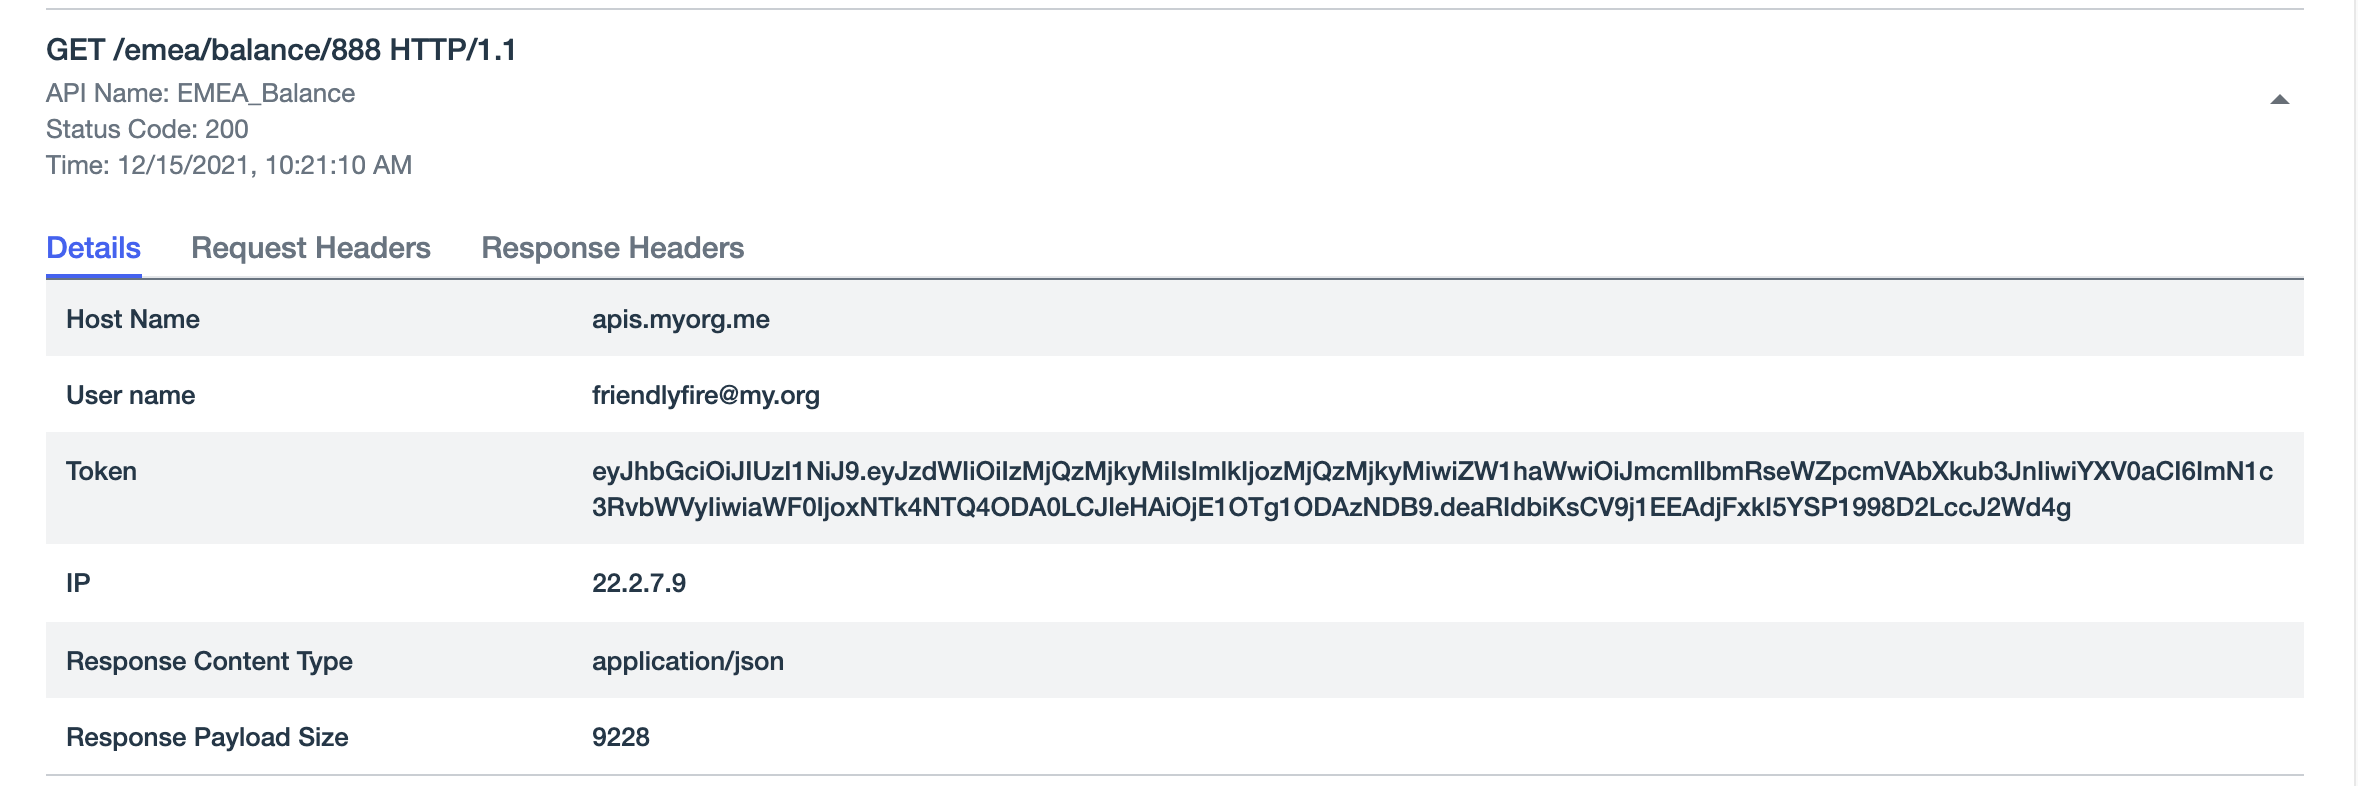
Click the drop down arrow on the right of a transaction to view parameter values in the tabs:
-
Details tab: View parameter values of the transaction’s host name, username, token, IP address, response content type and response payload size.

-
Request headers tab: View the transaction’s request header parameter values. Examples include authorization type, accept-encoding, host name, and accept response’s content type.

-
Response headers tab: View the transaction’s response header parameter values. Example include content type and content length.

-
-
Click X at the top right, to return to the previous dashboard.