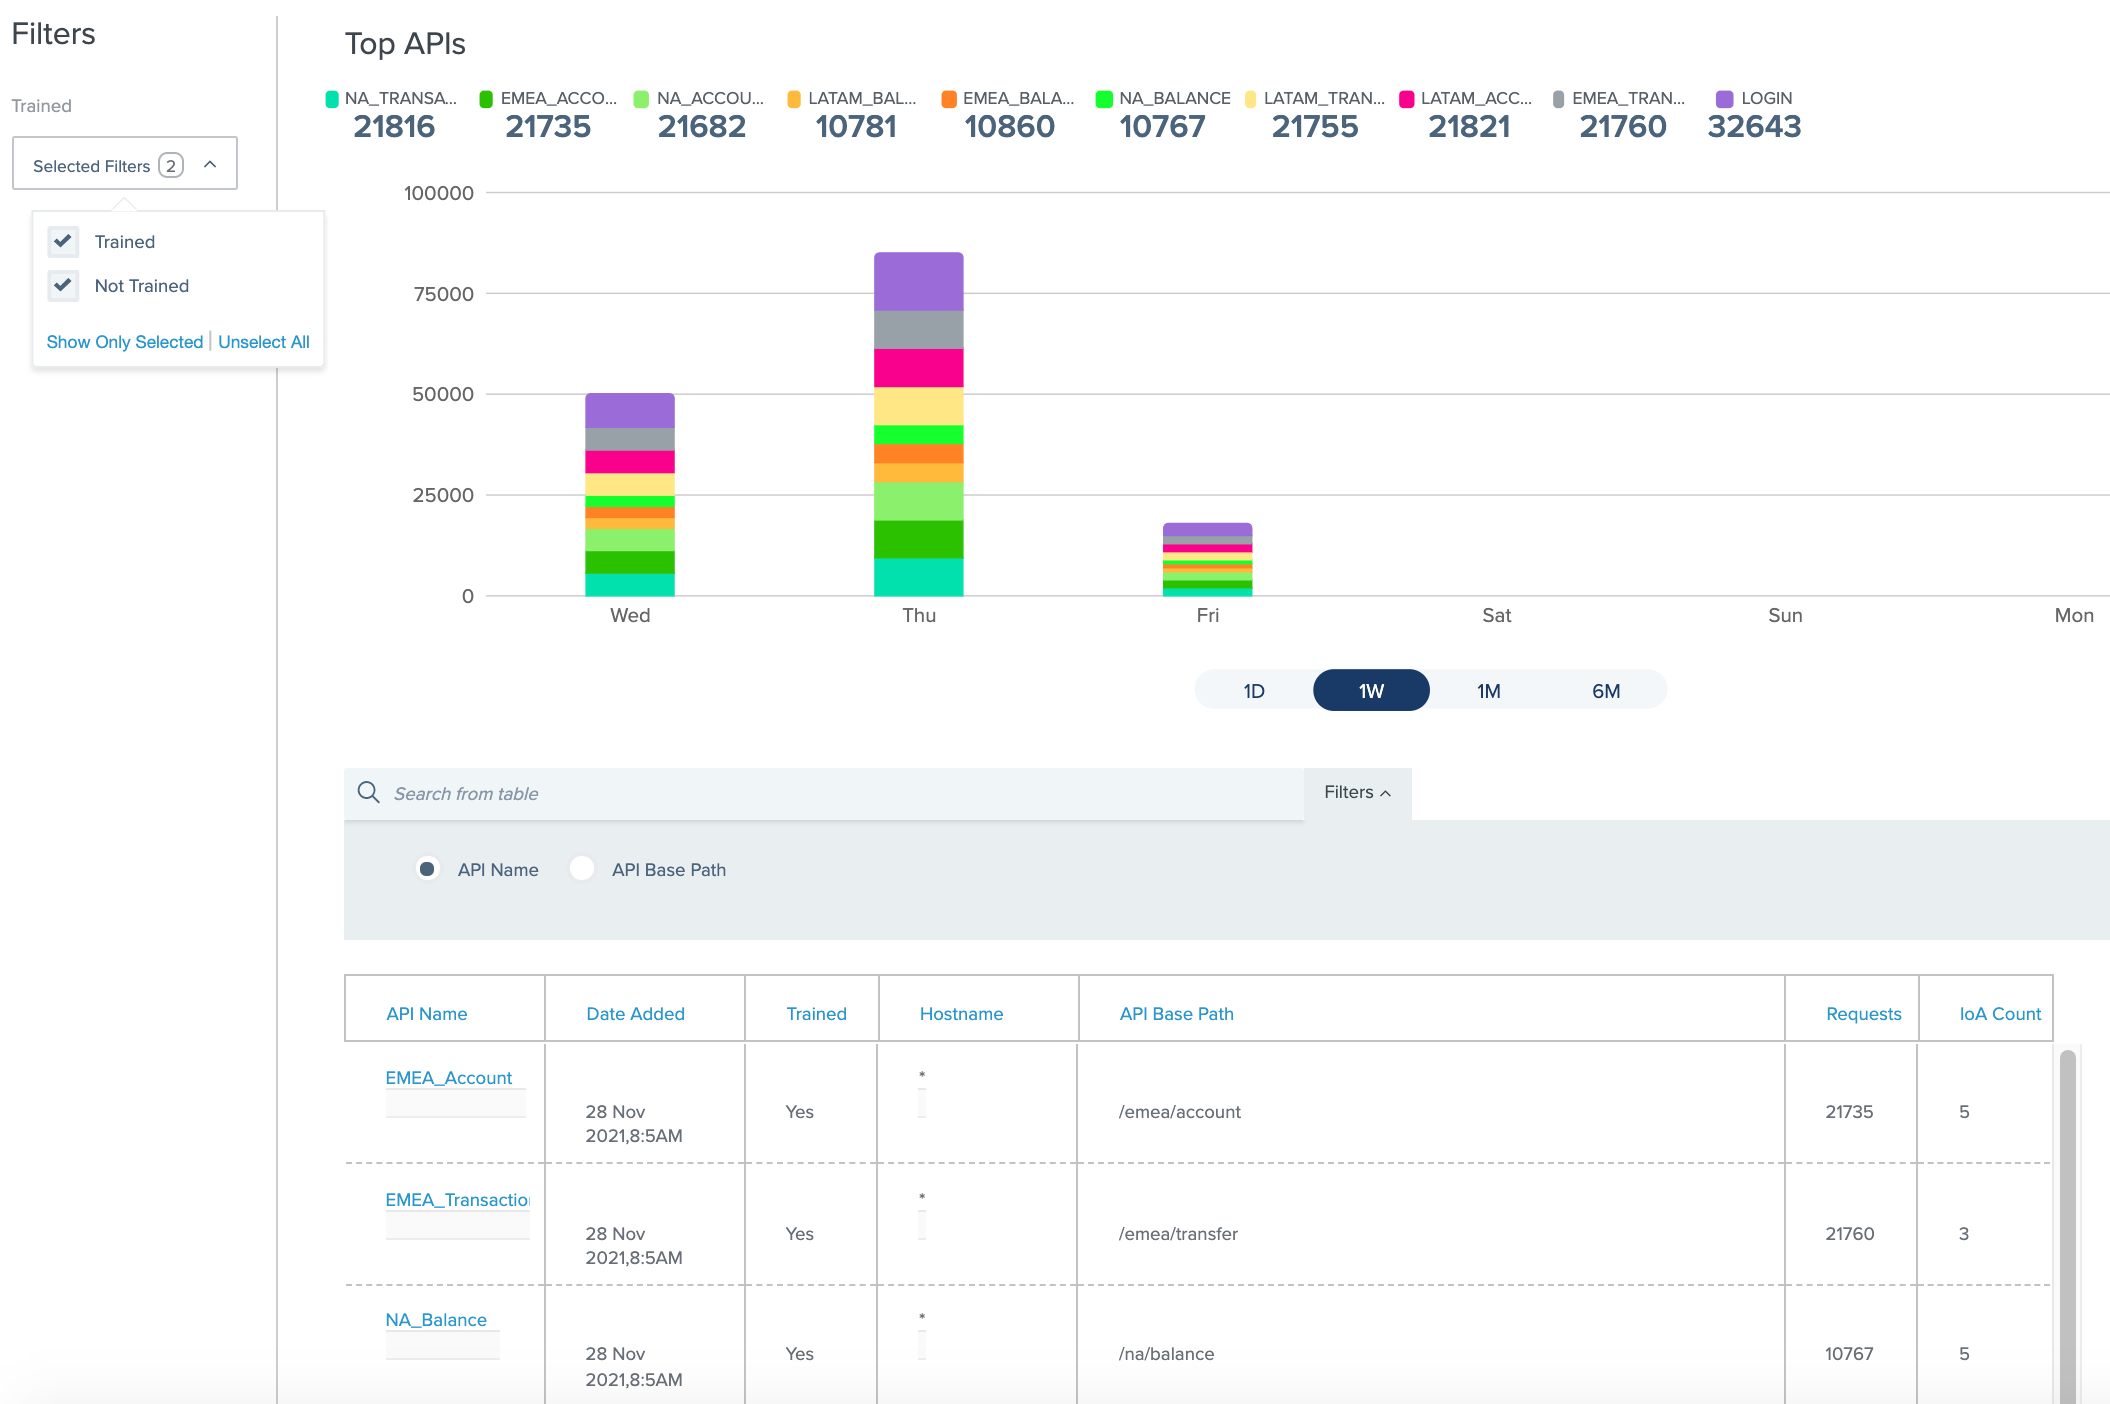
Top APIs
The Top APIs chart shows the distribution ratios of top application programming interface (API) request counts and indicators of attack (IoA) for the specified period.
To view the Top APIs chart details and drill-down information, click Dashboard → Top APIs.

Graph filters
The Trained graph filters are available. Select or clear the check boxes to include or exclude Trained or Not Trained APIs, for the specified selection.
Top APIs table
The filtered graph results are displayed in a table below the graph, for further drill-down, inspection and analysis.
| Column | Description | ||
|---|---|---|---|
API Name |
The name of the API. |
||
Date Added |
The date monitoring began on the API. |
||
Trained |
Indicates whether the AI engine is trained (Yes) or not trained (No) on the API.
|
||
Hostname |
The server hosting the API. |
||
API Base Path |
The Uniform Resource Identifier (URI) prefix for the API path, relative to the host root. |
||
Requests |
Accumulated count of requests to the API for the reported period. |
||
IoA count |
Accumulated count of IoAs on the API for the reported period. |
Sorting and filtering
Click on a table column heading to sort the table according to that column. Click on the column heading again to display a reverse sort according to that column.
Click Filters ^ to select filtering based on search strings or partial strings of the API Name or API Base Path. Enter the search string in the Search from table field. The search displays the matching rows in the table.
|
Select API Base Pathin the table filter, and enter /acc. The table is reduced further, displaying only the rows where the API Base Path column contains the string /acc.
API drill-down
In the Top APIs table, click on an API in the API Name column, to display the API activity dashboard with further details about that API’s activity in the reported period.