Policy query logging
PingAuthorize writes policy query information to the following logs:
policy-query.log-
Records query decision responses in embedded policy decision point (PDP) mode.
By default, this log file is located at
PingAuthorize/logs/policy-query.log.You can customize the logging behavior for policy query request, response, and permutation details with the Server SDK’s Policy Query Logger extension. Learn more in Server SDK Extensions.
debug-trace.log-
Records detailed information about the processing of HTTP requests and responses in embedded PDP mode.
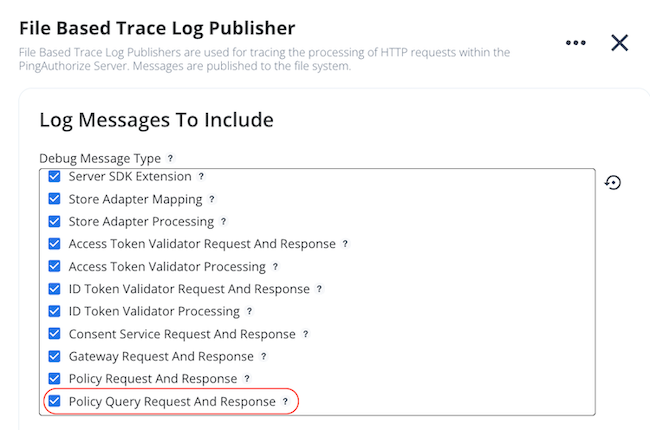
To include query requests and responses in
debug-trace.log:-
In the PingAuthorize admin console, go to Configuration > Logging, Monitoring, and Notification > Log Publishers.
-
Click Debug Trace Logger.
-
In the Log Messages to Include section, under Debug Message Type, select the Policy Query Request And Response checkbox.
-
Click Save.
-
query-audit.log-
Records query decision responses in external PDP mode.
Enabling debug logging in embedded PDP mode
Enable debug logging to provide detailed information when query requests produce errors or unexpected results. In addition to logging the full query request and response, debug logging records details about the resolution and policy dependencies of each attribute included in the query request. This level of detail can be necessary to troubleshoot the individual decision requests that make up a single query request.
|
Debug logging could log sensitive and personally identifiable information (PII). Enable debug logging only during troubleshooting and disable it afterward. |
In debug mode, a policy query log entry includes the following fields:
-
requestId: A unique identifier for the query request -
permutationId: A unique identifier for the query permutationA query permutation is a combination of query attributes used for a decision in the final query response. Use this identifier and the
requestIdfor increased visibility of query request information across your logging system. For example, a logged call to an external information point would include identifiers for the request and permutation that invoked that service. -
permutation: A query permutation as an array of JSON objects containing each query attribute and its value -
response: The complete, high-verbosity response for a query permutation’s associated decision, including expanded errors and other helpful informationBy default, this field includes details about the resolution and policy dependencies of each attribute involved in the permutation’s corresponding decision, along with details about any external service used in that decision.
You can increase the
responsefield’s level of detail by controlling the query permutation view. Learn more in Configuring the query permutation view.
The following is an example of a policy query request body and its associated audit log messages. The response field is shortened for the sake of brevity.
{
  "query": [
    {
      "attribute": "Account"
    },
    {
      "attribute": "Action",
      "values": ["read"]
    },
    {
      "attribute": "User",
      "values": ["Bob"]
    }
  ]
}
[06/Jun/2025:15:28:08 +0100] QUERY requestID=103 correlationID="d08fe710-7394-41f9-9a80-26009f2bbd6e" queryId=072a9fbf-528a-4f71-9045-ad541e7c2d73 {"requestId":"072a9fbf-528a-4f71-9045-ad541e7c2d73","permutationId":"89f37761-8b9f-4b2a-91e0-392e64da84cd","permutation":[{"attribute":"User","value":"Bob"},{"attribute":"Action","value":"read"},{"attribute":"Account","value":"{\"owner\":\"Bob\",\"id\":2,\"type\":\"checking\"}"}],"response":{"id":"89f37761-8b9f-4b2a-91e0-392e64da84cd"}}
[06/Jun/2025:15:28:08 +0100] QUERY requestID=103 correlationID="d08fe710-7394-41f9-9a80-26009f2bbd6e" queryId=072a9fbf-528a-4f71-9045-ad541e7c2d73 {"requestId":"072a9fbf-528a-4f71-9045-ad541e7c2d73","permutationId":"010c4062-92da-432f-a5f6-66b0a901c480","permutation":[{"attribute":"User","value":"Bob"},{"attribute":"Action","value":"read"},{"attribute":"Account","value":"{\"owner\":\"John\",\"id\":3,\"type\":\"savings\"}"}],"response":{"id":"010c4062-92da-432f-a5f6-66b0a901c480”,…}}
A single query request is separated into permutations in the log:
-
Each possible combination of query attributes becomes a separate
permutationwith its own unique identifier and decision details. -
Each
permutationis recorded as its own distinct log message. -
All permutations from the same query request are linked together by a shared
requestId,correlationID, andqueryId. -
The log entry for each query request includes a total count of permutations.
You can enable debug logging for the policy query audit log in the PingAuthorize admin console or with dsconfig.
-
Admin console
-
dsconfig
Steps
-
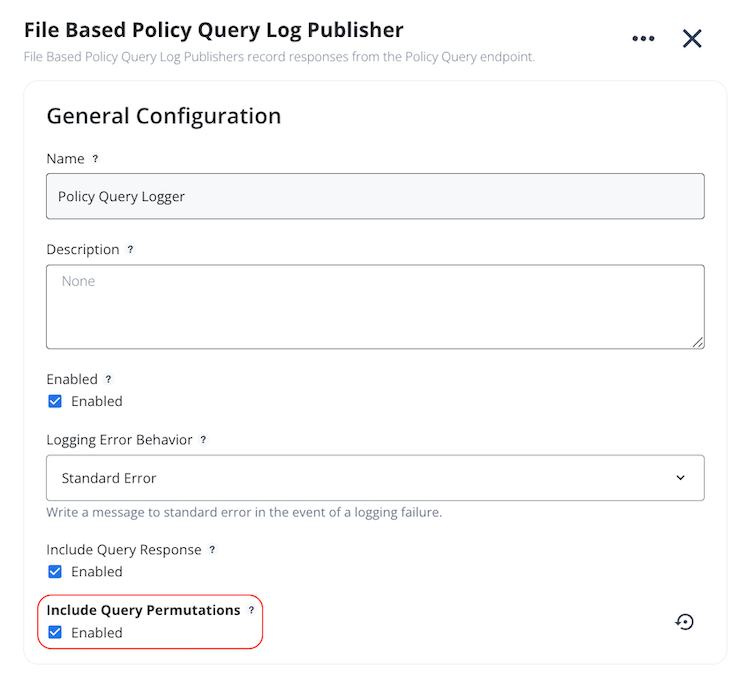
In the PingAuthorize admin console, go to Configuration > Logging, Monitoring, and Notifications > Log Publishers.
-
Click Policy Query Logger.
-
Under Include Query Permutations, select the Enabled checkbox.
-
Click Save.
Steps
-
Enable the file-based Policy Query Logger.
dsconfig set-log-publisher-prop --publisher-name "Policy Query Logger" --set enabled:true -
Use the
dsconfig set-log-publisher-propcommand with the following arguments:dsconfig set-log-publisher-prop --publisher-name "Policy Query Logger" --set include-query-permutations:true
Configuring the query permutation view
In addition to enabling query permutations in the Policy Query logger, you can specify additional levels of detail to include in each permutation’s response field. The Policy Query logger provides the following additional views:
-
request: Includes the decision request object -
decision-tree: Includes details of the policy tree’s evaluation flow -
attributes: Includes details of attributes used during policy evaluation, including the attribute’s value and typeSpecifying this view overrides any attribute logging configured for embedded mode.
-
services: Includes details of services invoked during policy evaluation
|
Specifying additional views will impact performance. Use these views for troubleshooting purposes and disable them afterward. |
You can configure the query permutation view in the PingAuthorize admin console or with dsconfig.
-
Admin console
-
dsconfig
Before you begin
Create a Policy Query Logger with debug logging enabled.
Steps
-
In the PingAuthorize admin console, go to Configuration > Authorization and Policies > Policy Decision Service.
-
In the Policy Query Configuration section, under Query Logger Permutation View, select the desired logging views.

-
Click Save.
Before you begin
Create a Policy Query Logger with debug logging enabled.
Steps
-
Use the
dsconfig set-policy-decision-service-propcommand with the--add query-logger-permutation-viewargument to add query permutation views:dsconfig set-log-publisher-prop --add query-logger-permutation-view:attributes --add query-logger-permutation-view:services -
Use the
dsconfig set-policy-decision-service-propcommand with the--remove query-logger-permutation-viewargument to remove query permutation views:dsconfig set-log-publisher-prop --remove query-logger-permutation-view:attributes
You can also configure policy query debug logging for policy development and testing in the Policy Editor. Learn more in Configuring policy query debug logging in the Policy Editor.