Threat Protection Dashboard
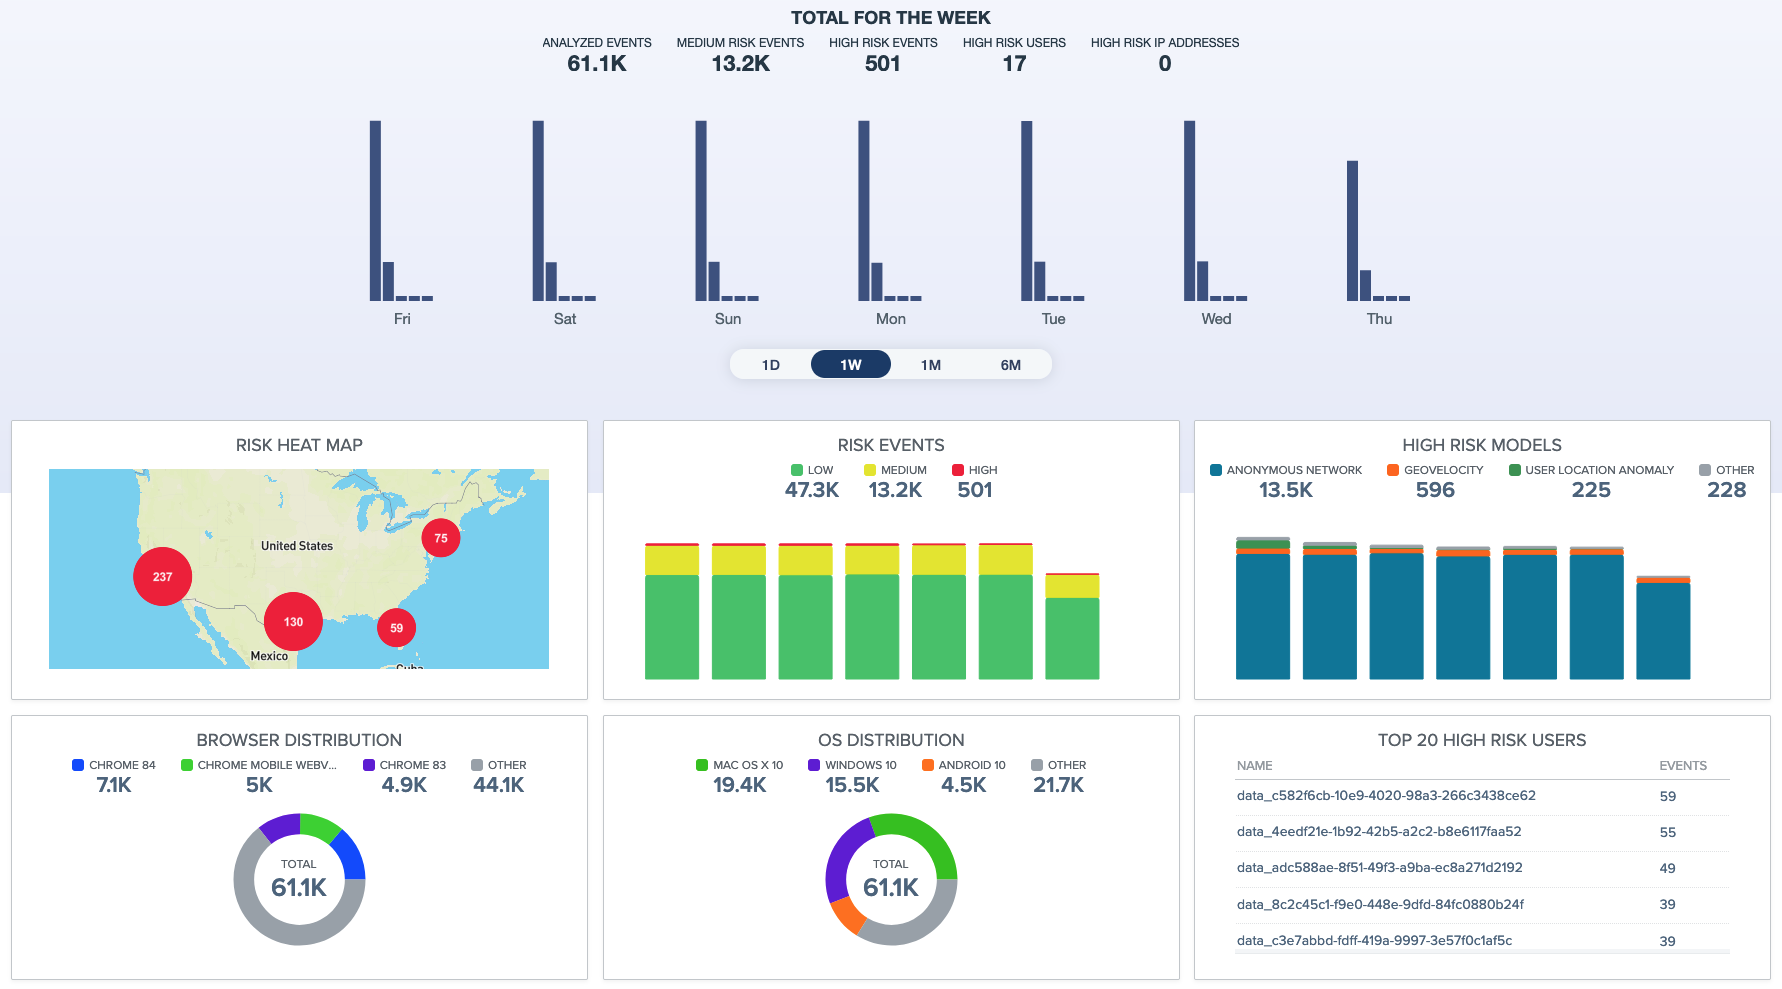
The Threat Protection Dashboard provides a visual representation of PingOne Protect data.
To access the Threat Protection Dashboard, in the PingOne admin console, go to Monitoring > Threat Protection.

Risk totals chart
The Threat Protection Dashboard shows the Risk totals chart, which summarizes all risk events analyzed in the selected time period. You can use the slider under the Risk summary chart to show data from the current day, past week, past month, or past six months. The columns in the chart rescale to show information over the selected time period. You can hover over a column to show the specific period it represents.
The columns in the chart rescale to show information over the selected time period. Each column is broken down into five sub-columns, defined at the top of the chart from left to right:
-
Analyzed events
-
Medium risk events
-
High risk events
-
High risk users
-
High risk IP addresses
In addition to the Risk totals chart, the Threat Protection Dashboard consists of the following graphs, each of which can be expanded for greater detail:
Risk details
|
Only users with the |
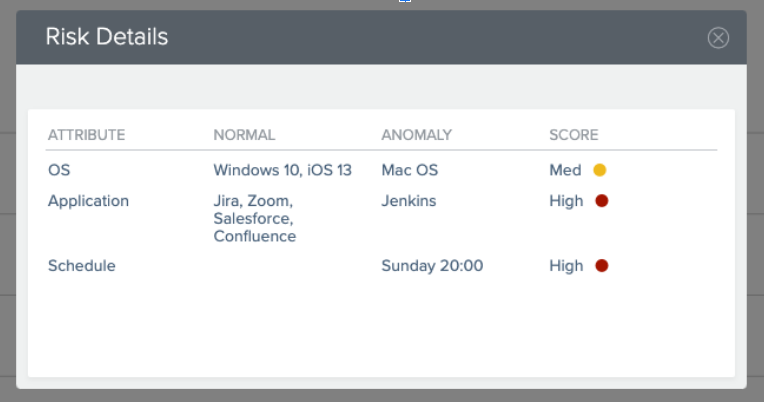
In the monitored risk data tables, if the User Based Risk Behavior score is Medium or High, click the score to show the Risk Details window.

The Risk Details window compares values of the anomalous transaction to typical user behavior.

| Column | Description |
|---|---|
Attribute |
The category of the anomalous transaction |
Normal |
Typical values of the transaction category, according to normal user behavior |
Anomaly |
The anomalous value in the transaction |
Score |
The risk level of the anomaly |
Filtered searching
The filtered search bar appears above each table of risk data.

-
Click Filters to toggle the list of filter options.
-
Use the check boxes to select filters.
-
If you enter free text without choosing at least one filter, the search displays all table rows containing the entered text.
-
Wild card searches using an asterisk (
\*) are not supported. -
A space is a significant character in a search string. For example,
Chrome<space>Mobileworks.Chrome<space><space>Mobiledoes not work. -
Use of quotation marks is not supported.
-
The left-hand search filters operate first. Subsequent use of the filtered search bar produces a subset of the prior left-hand filter.
For example, in the Country list, select India. The table shows results for India only.
In the filtered search bar, select OS and enter
Android 10. The table is reduced to show only users from India signing on from an Android 10 device.Learn more about the left-hand filters in Threat Protection Dashboard filters.