Monitoring activity with Splunk
Use Splunk to monitor PingOne activity data.
Installing the PingOne App for Splunk
The PingOne App for Splunk correlates your PingOne data into a meaningful dashboard. The app allows you to create custom dashboards and reporting, monitor activity data, and analyze event data over time.
Before you begin
You must:
-
Have a Splunk administrator account.
-
Create a webhook to send your PingOne data to your Splunk instance. We recommend collecting the data in
index=pingoneso that the data model attached to the PingOne App for Splunk will automatically pick up the data.-
Create a data input in Splunk to receive the webhook data from PingOne. In Splunk, click Settings > Data inputs.
-
For HTTP Event Collector, click +Add new. Send the data to
index=PingOne. Make sure to copy the token provided by Splunk. Learn more in the Splunk HTTP Event Collector documentation.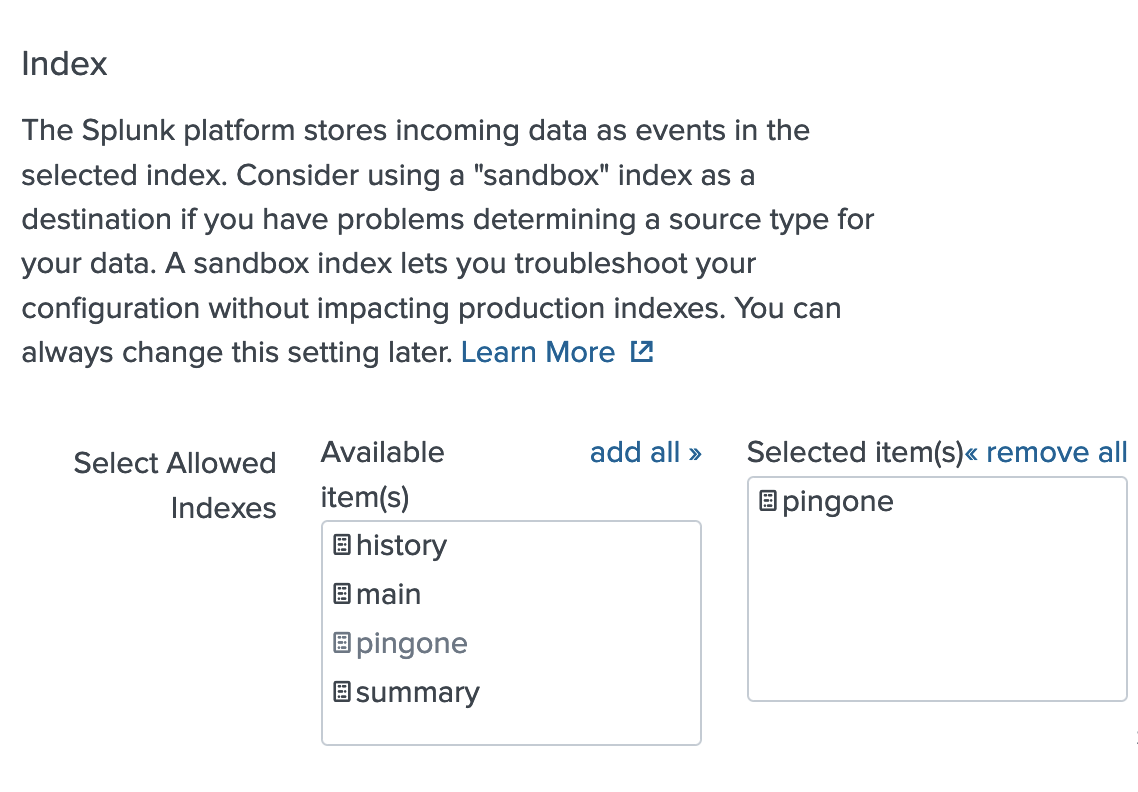
To use a different index, refer to step 2 below to configure the PingOne App for Splunk to capture webhook data stored in other indexes.
-
Create the webhook in PingOne and add a custom header, where you can enter the token provided by Splunk when you created the HTTP Event Collector input.
-
-
Download the PingOne App for Splunk package in Splunkbase. Search for
PingOnein Splunkbase to find the file.
About this task
To install the PingOne App for Splunk:
Steps
-
Sign on to Splunk and install the PingOne App for Splunk.
-
Click Apps > Manage Apps.
-
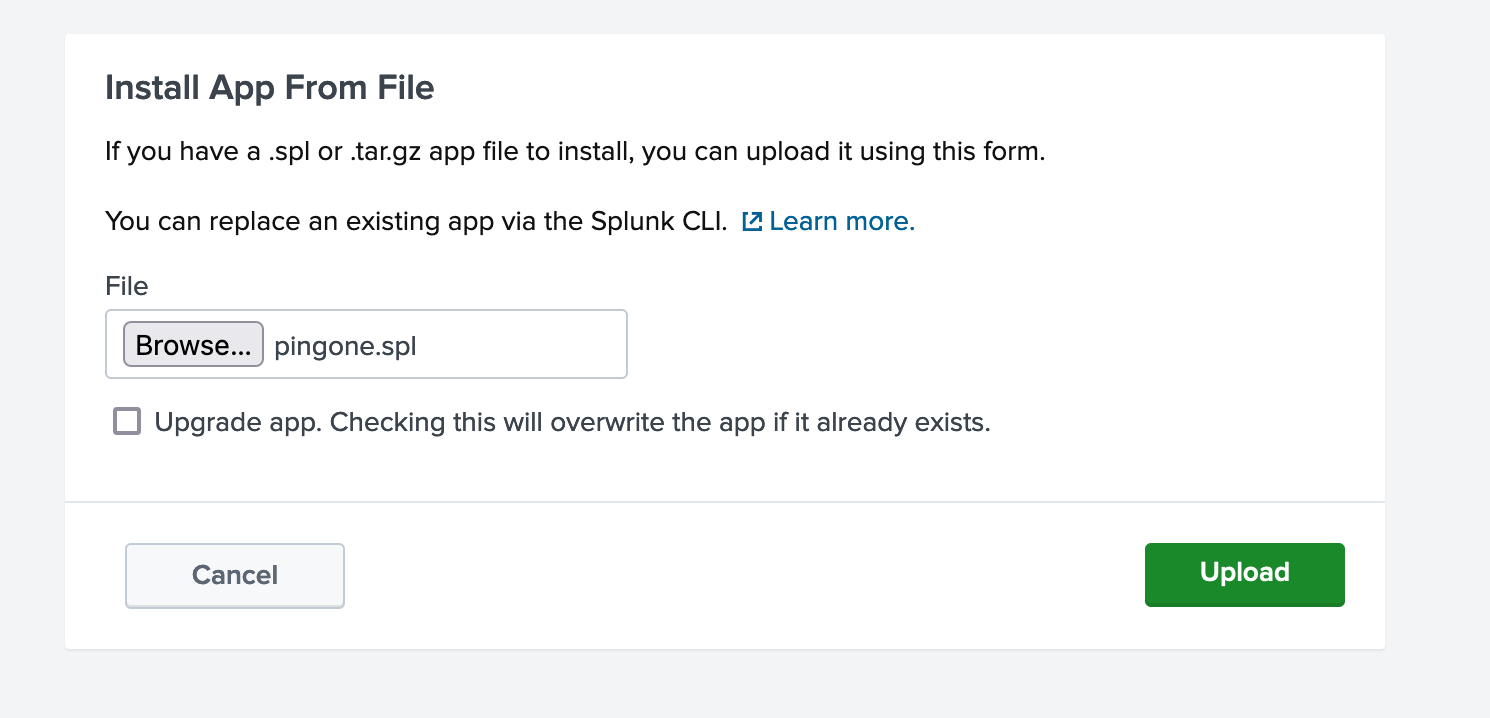
Click Install app from file.

-
To upload the PingOne App for Splunk package file, click Browse, select the file, and then click Upload.
-
-
If your data is not in
index=pingone, modify the macro to point to your data:-
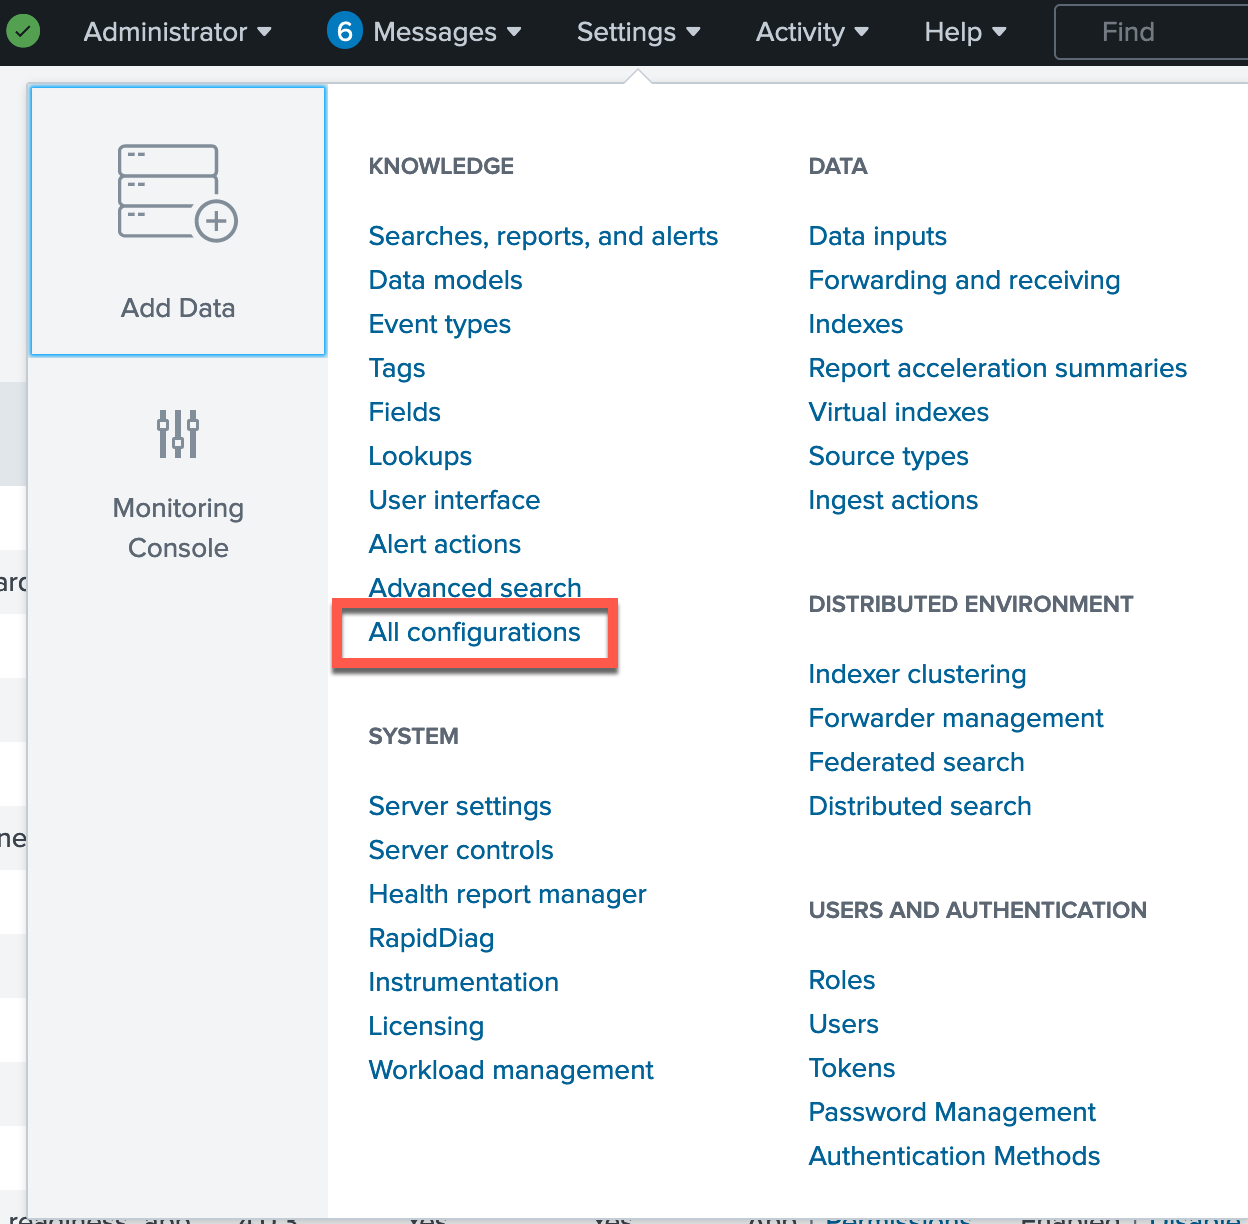
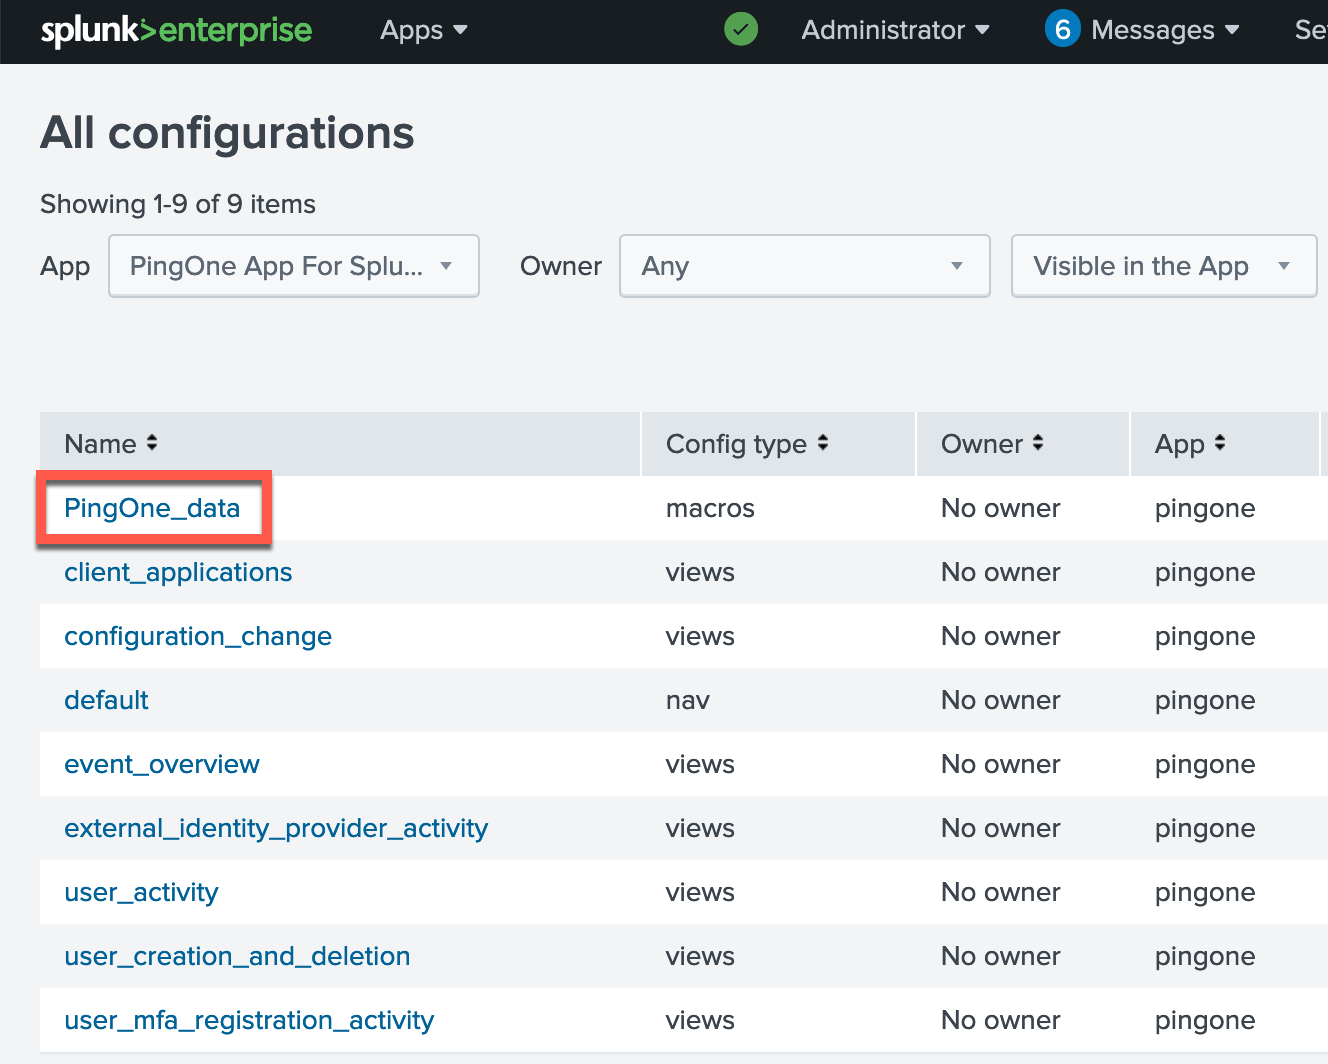
Click Settings > All configurations.
-
For the App field, filter on PingOne App for Splunk configurations and select the PingOne_data macro.
-
To point the macro to your data, enter your index in the Definition box.
The default is
index=PingOne. Below is an example definition.
-
-
(Optional) Accelerate your data model to make a summary index of PingOne data.
The summary index results in more efficient population of the dashboards and allows you to populate the tables over larger time ranges.
-
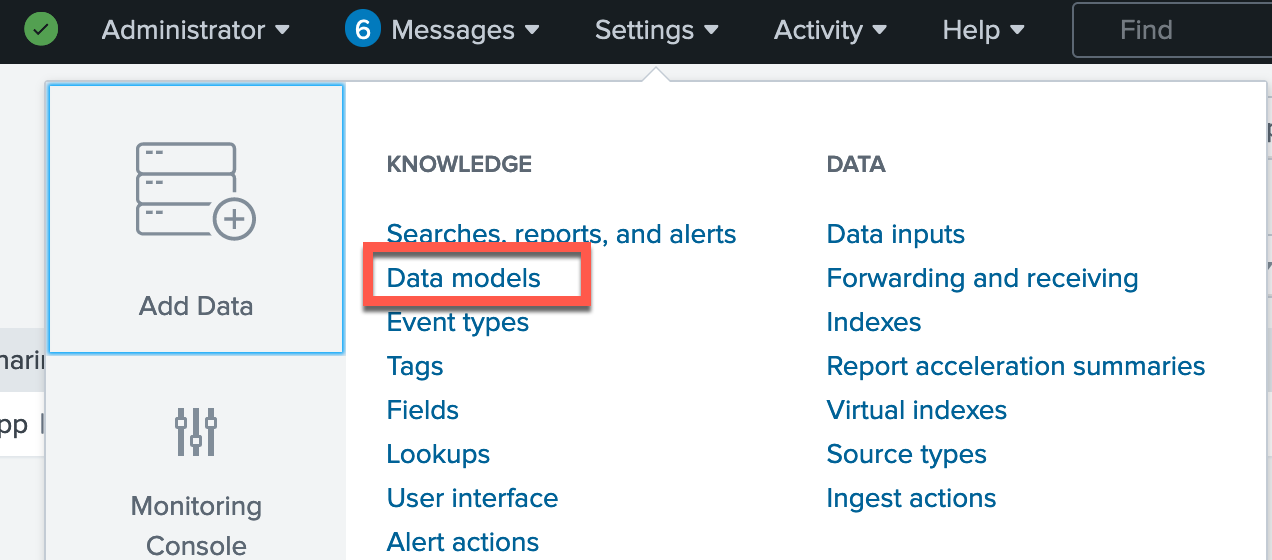
Go to Settings > Data models.
-
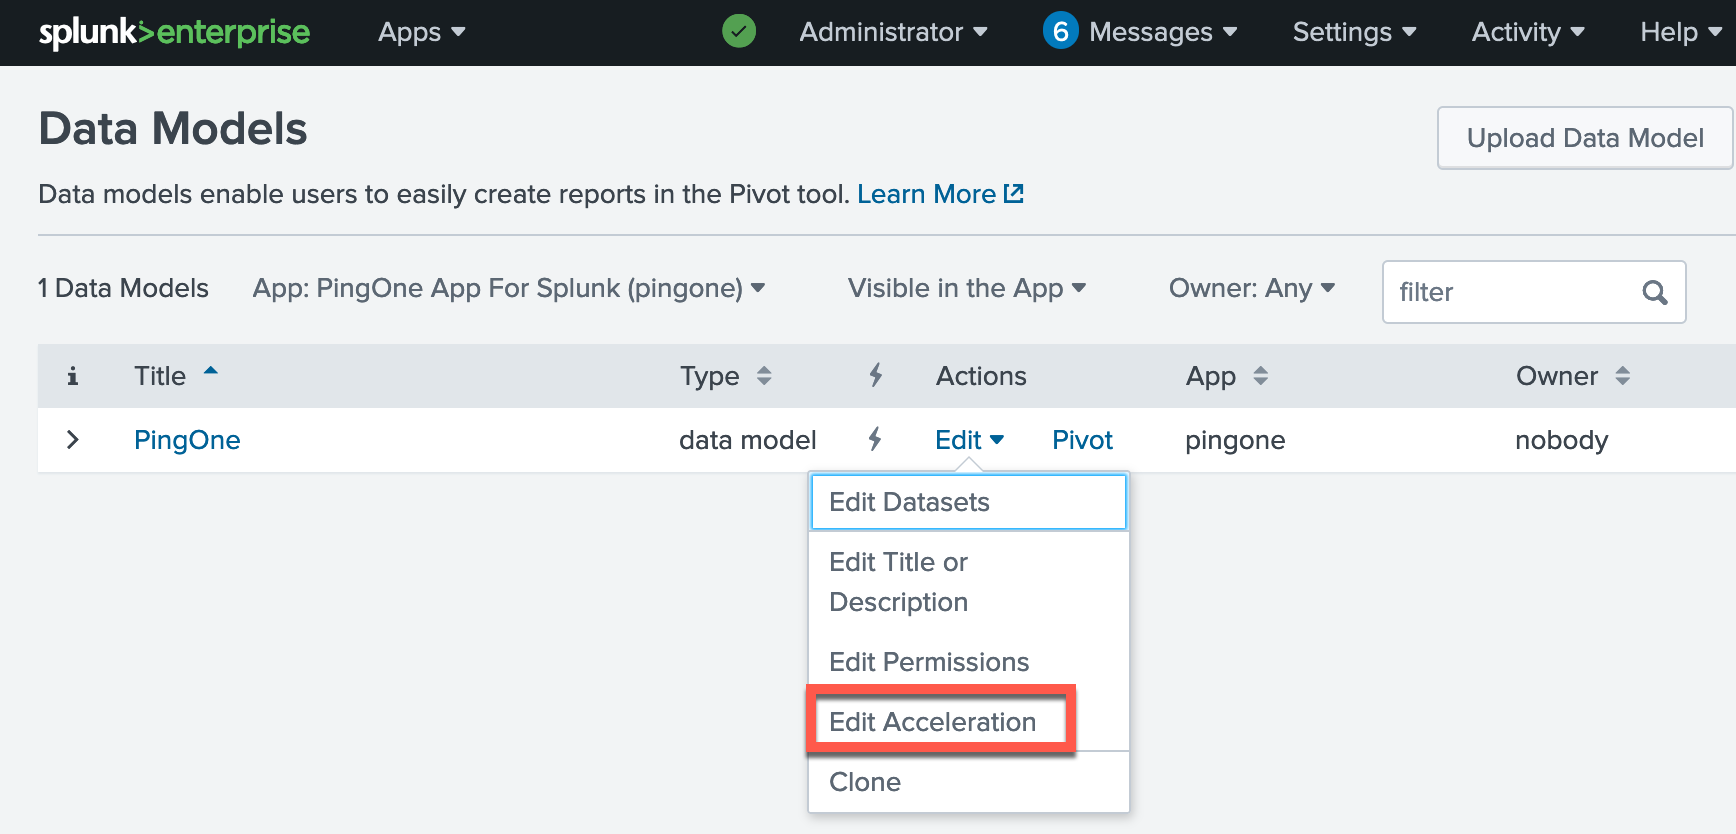
Click Edit > Edit Acceleration for the PingOne data model.
-
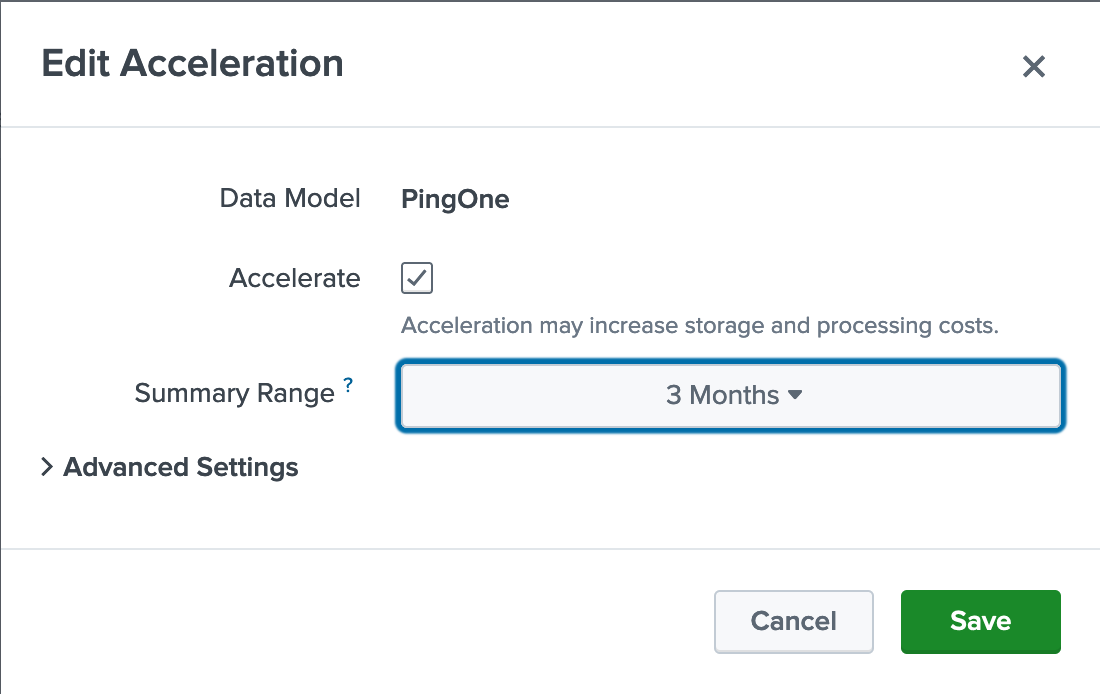
In the Edit Acceleration window, select the Accelerate checkbox.
-
Select a Summary Range. Click Save.
The dashboards only display accelerated data through the summary range selected, so choose a time range accordingly.
It will take time for the summary index to build.
-
Troubleshooting the PingOne App for Splunk
See the following information for help troubleshooting the dashboards in the PingOne App for Splunk.
Why do some of the graphs not populate?
If there are no results returned within the selected time range given, the dashboard widget shows as blank. If this activity is limited to one widget, such as a table or chart, on a dashboard, this likely means there were no relevant events to populate the chart.
Why do the Event Detail charts have a count listed?
The data model collects aggregate data, which is used to populate the dashboards. Because the data collected are not raw log events, it’s possible for multiple matching events to be aggregated. As an example, if a user account was unlocked 3 times in a second by the same administrator, the count value would be 3.
How do the dashboard table fields translate from PingOne webhook JSON data?
In the PingOne App for Splunk prebuilt dashboards, the PingOne webhook JSON data translates to the following table headings.
| JSON Key | Field Name |
|---|---|
|
Action |
|
Description |
|
Status |
|
Client ID |
|
Environment ID |
|
Client Application |
|
Actor ID |
|
Actor |
|
Target Resource |
|
Action |
What does "N/A" mean when populated into a field such as Actor (actors.user.name)?
In this case, "N/A" means that no value was included with the event. For instance, if the activity was performed by a worker app instead of a user account, the corresponding event data would have an N/A value in the dashboard results.
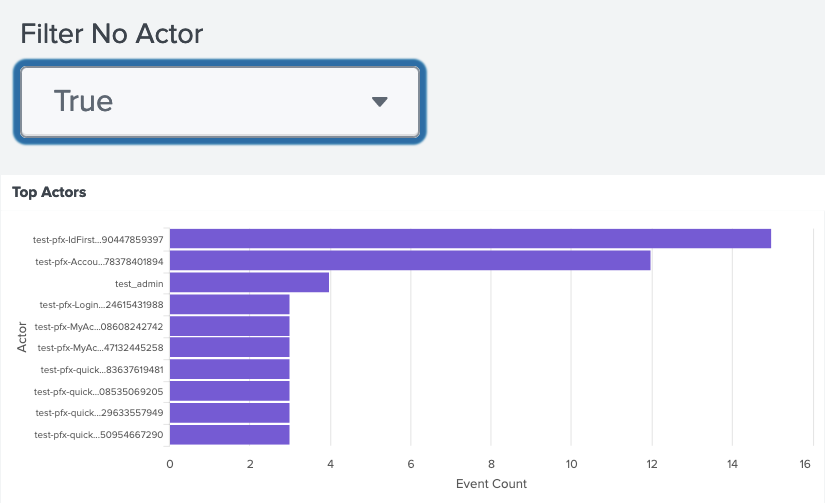
Certain dashboards allow you to filter N/A values in the results. For the User Activity dashboard:
-
If Filter No Actor is set to
False, N/A values are displayed.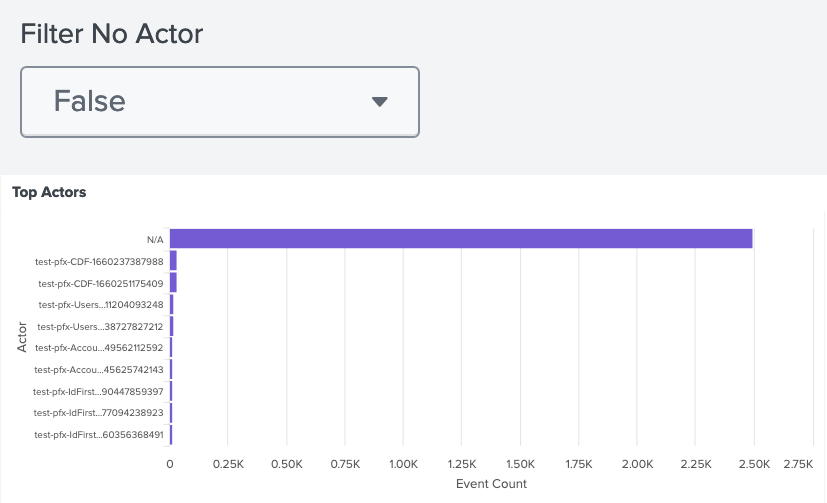
-
If Filter No Actor is set to
True, N/A values will be removed from the results.