Authorization Dashboard
The Authorization Dashboard shows a summary of authorization activity generated by requests to PingOne Authorize decision endpoints.
To access the Authorization Dashboard, go to Monitoring > Authorization.
![Screen capture of the [.uicontrol]**Authorization Dashboard** showing the filter and charts for Total Authorizations, Authorizations by Date with Average Service Time in milliseconds, Decision Counts by Date, and Service Execution Information.](_images/p1-az-dashboard.png)
Filters
Use filters to refine the data displayed on the dashboard. You can limit data to a specific time range:
-
Today: Displays data for the current day only.
-
From Yesterday: Displays data for the previous day only.
-
Last 7 Days (default): Displays data for the previous 7 days only.
-
Last 30 Days: Displays data for the previous 30 days only.
-
This Month: Displays data for the current calendar month only.
-
Last Month: Displays data for the previous calendar month only.
-
Last 6 Months: Displays data for the previous 6 months only.
This filter applies to all charts on the dashboard.
|
PingOne aggregates data at regular intervals. It can take up to 30 minutes for decision requests to show up on the dashboard. |
Charts
Use the following controls to adjust the charts:
| Icon | Name | Description |
|---|---|---|
|
Maximize |
Expands the chart to fill the dashboard. To minimize the chart, click the icon again. |
|
Menu options |
Options can vary for different types of charts:
|
|
Sort visual |
Sorts the chart data in ascending or descending order. |


Total Authorizations
Displays the total number of authorization decisions across all decision endpoints during the selected time period.
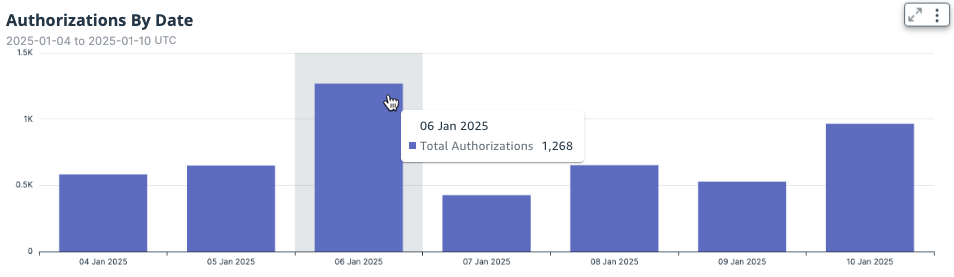
Authorizations by Date
Displays a bar chart that shows the number of authorization decisions by date. Hover over a bar to display the number of authorizations on that date.