Troubleshooting test connection failure
The following information applies to the various configuration error scenarios. You can use your connections details page, Splunk logs, or Postman to identify and resolve issues.
|
If you are establishing a connection for the first time, make sure that you have a webhook to connect your PingOne environment to Splunk. This will help you troubleshoot your connection. Learn more in Installing the PingOne app for Splunk. |
I am getting a validation error.
A validation error occurs if you didn’t enter all required configurations in the Configure Authentication panel in your PingOne admin console.
Verify that you have entered all the necessary configurations for your connection and click Test Connection.
|
Validation errors show the configuration that is required to have a successful connection, such as a Client ID, SCIM URL, and so on. |

I entered all my configurations and am still getting an error message.
If you receive this error message and have entered all your configurations, it might be a problem with the configuration itself.
In your Splunk logs, check for any possible errors, such as a 400 or 500 error.
Reviewing a Splunk log can identify the error, such as a missing letter from your client ID or incorrect URL, and help you resolve it in the admin console.

What other testing can I do to troubleshoot a test connection failure?
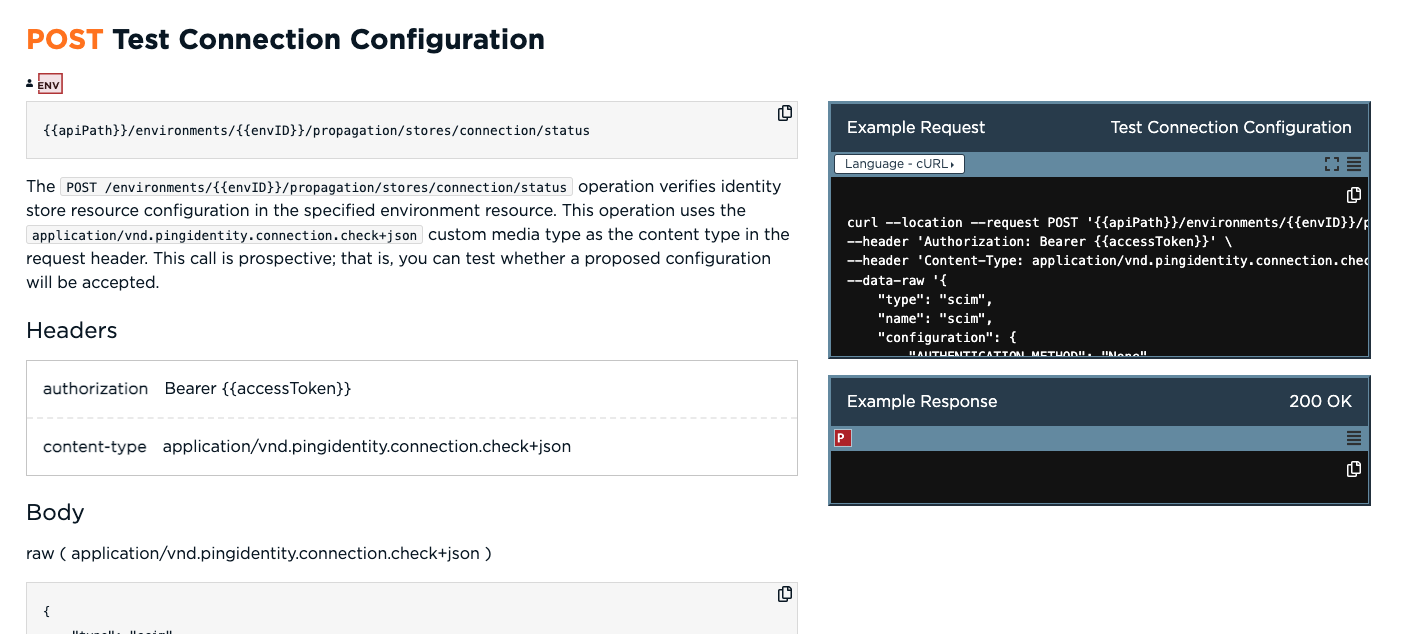
For further testing your connection configuration, use the POST: Test
Configuration call in Postman, as shown in the following cURL example. When you test this call, the response returned will include a success message or bad request message.
