Installing the PingOne App for Splunk
The PingOne App for Splunk correlates your PingOne data into a meaningful dashboard. The app allows you to create custom dashboards and reporting, monitor activity data, and analyze event data over time.
Before you begin
You must:
-
Have a Splunk administrator account.
-
Create a webhook to send your PingOne data to your Splunk instance. We recommend collecting the data in
index=pingoneso that the data model attached to the PingOne App for Splunk will automatically pick up the data.-
Create a data input in Splunk to receive the webhook data from PingOne. In Splunk, click Settings → Data inputs.
-
For HTTP Event Collector, click +Add new. Send the data to
index=pingone. Make sure to copy the token provided by Splunk. For more information, refer to the Splunk HTTP Event Collector documentation.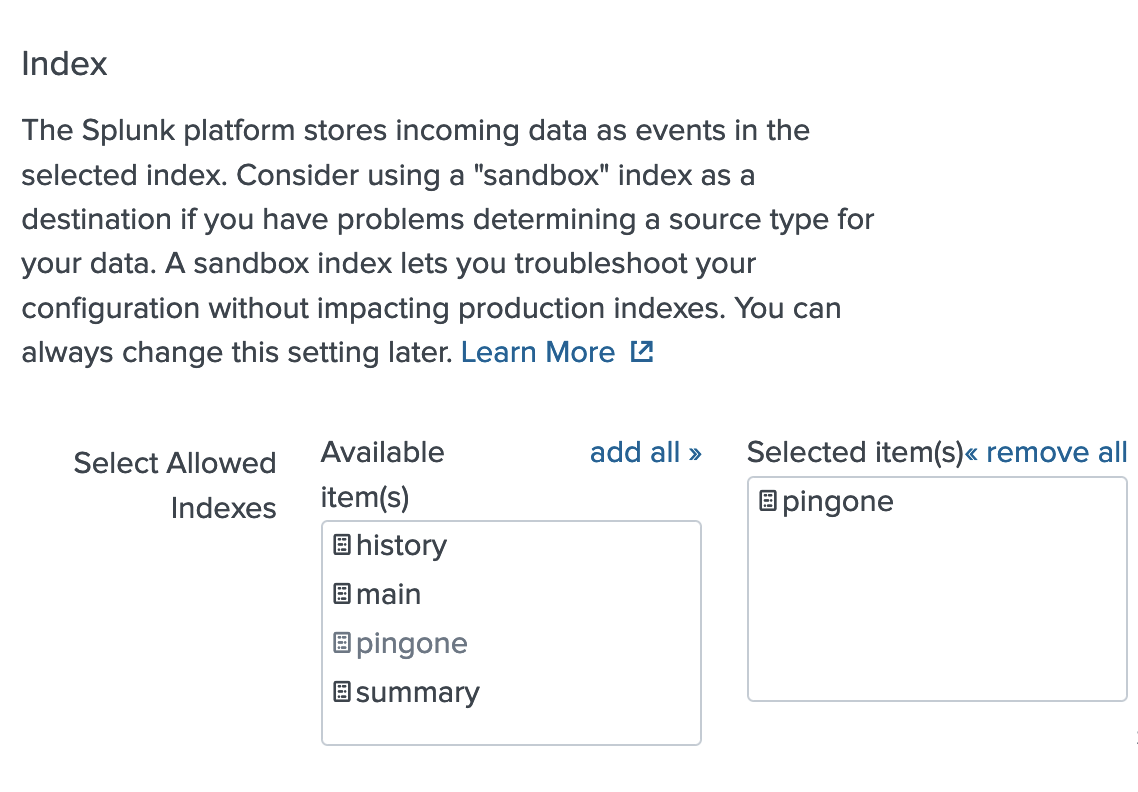
To use a different index, refer to step 2 below to configure the PingOne App for Splunk to capture webhook data stored in other indexes.
-
Create the webhook in PingOne and add a custom header, where you can enter the token provided by Splunk when you created the HTTP Event Collector input.
-
-
Download the PingOne App for Splunk package in Splunkbase. Search for
pingonein Splunkbase to find the file.
About this task
To install the PingOne App for Splunk:
Steps
-
Sign on to Splunk and install the PingOne App for Splunk.
-
Click Apps → Manage Apps.
-
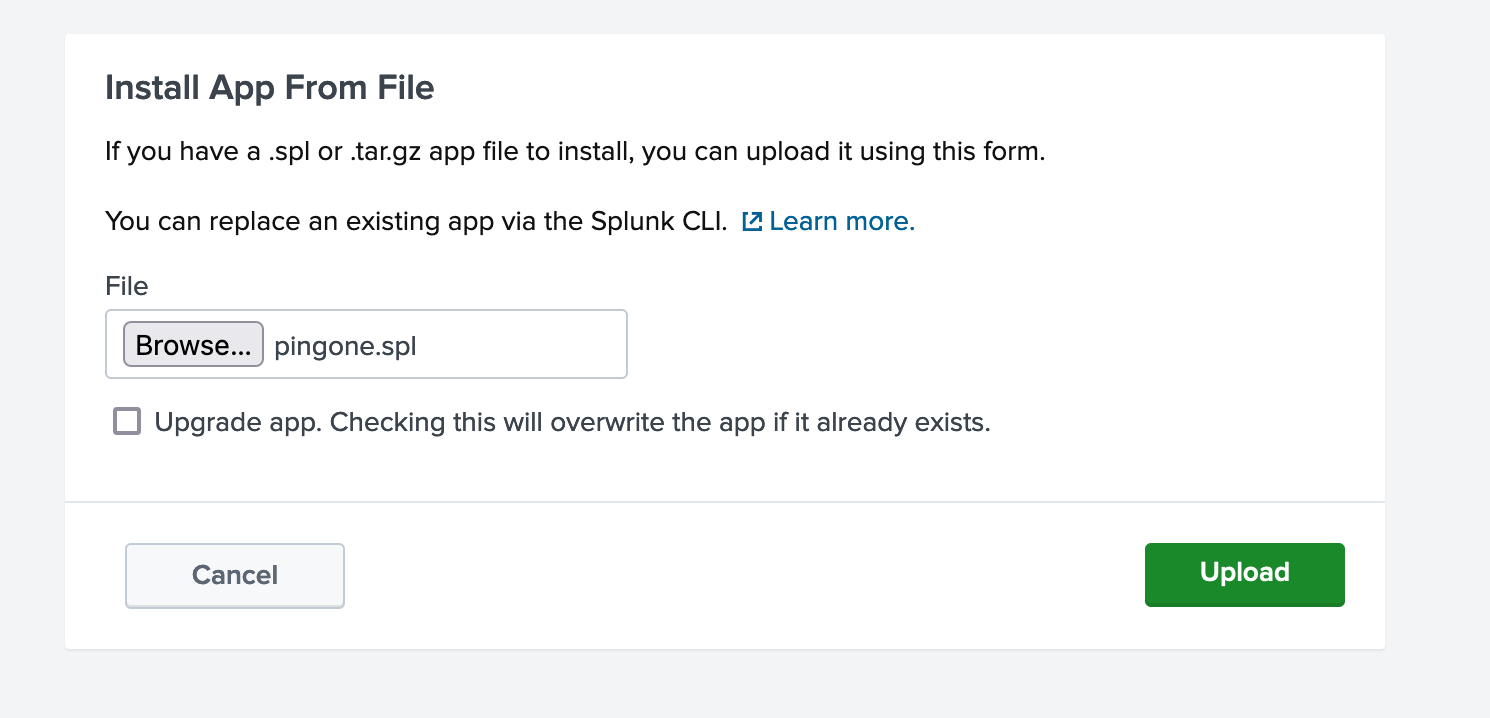
Click Install app from file.

-
To upload the PingOne App for Splunk package file, click Browse, select the file, and then click Upload.
-
-
If your data is not in
index=pingone, modify the macro to point to your data:-
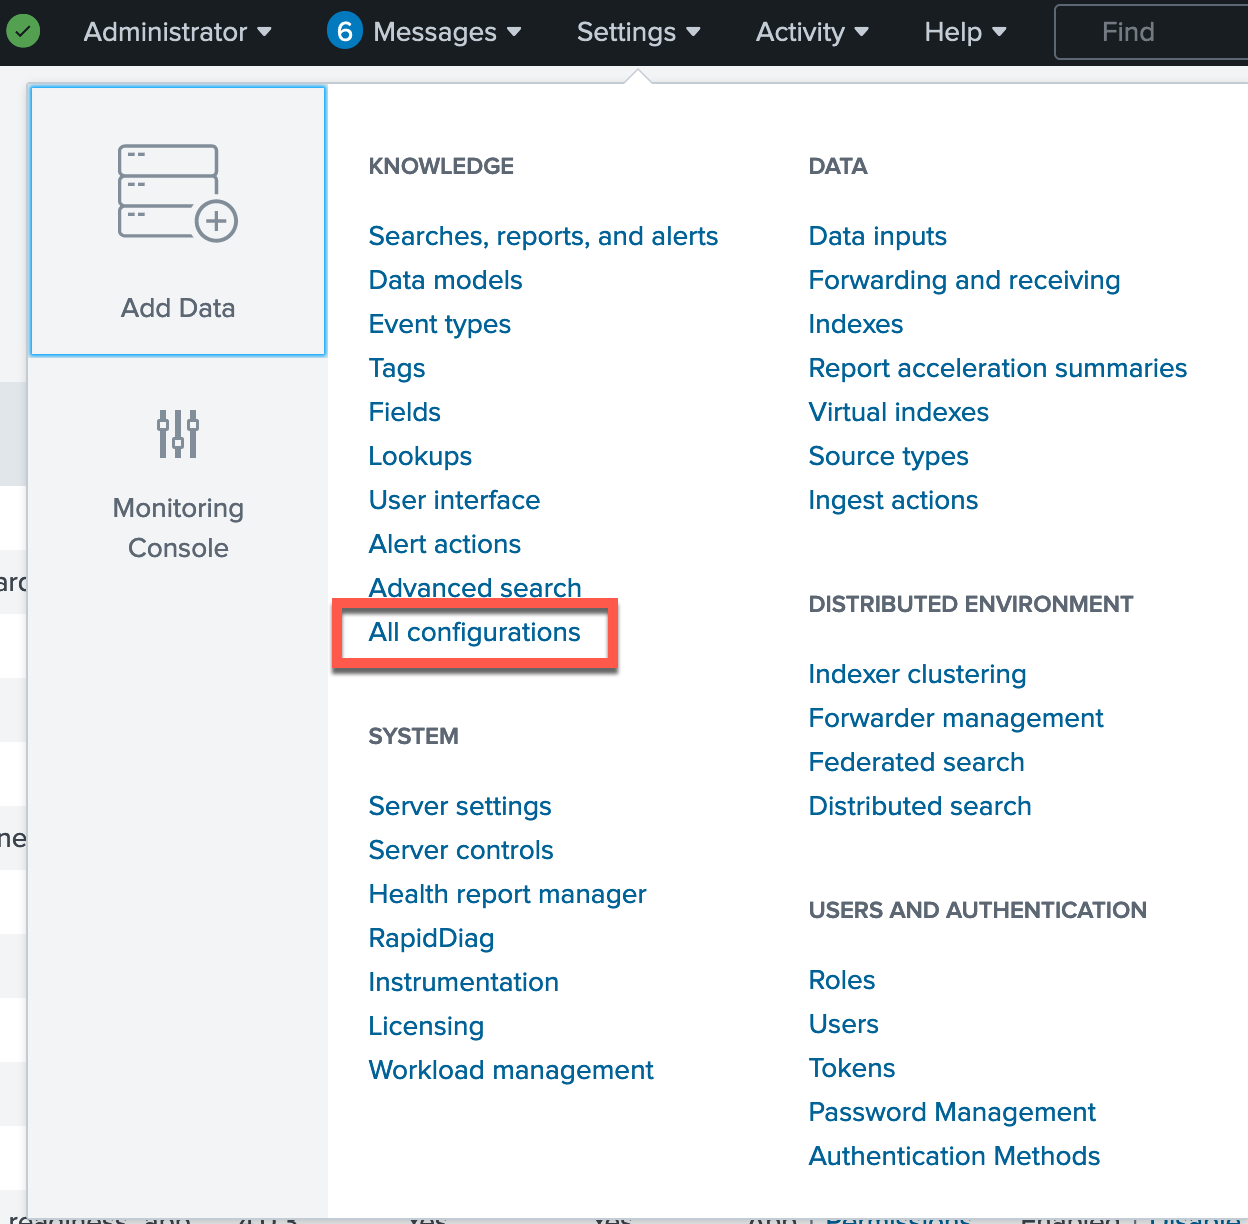
Click Settings → All configurations.
-
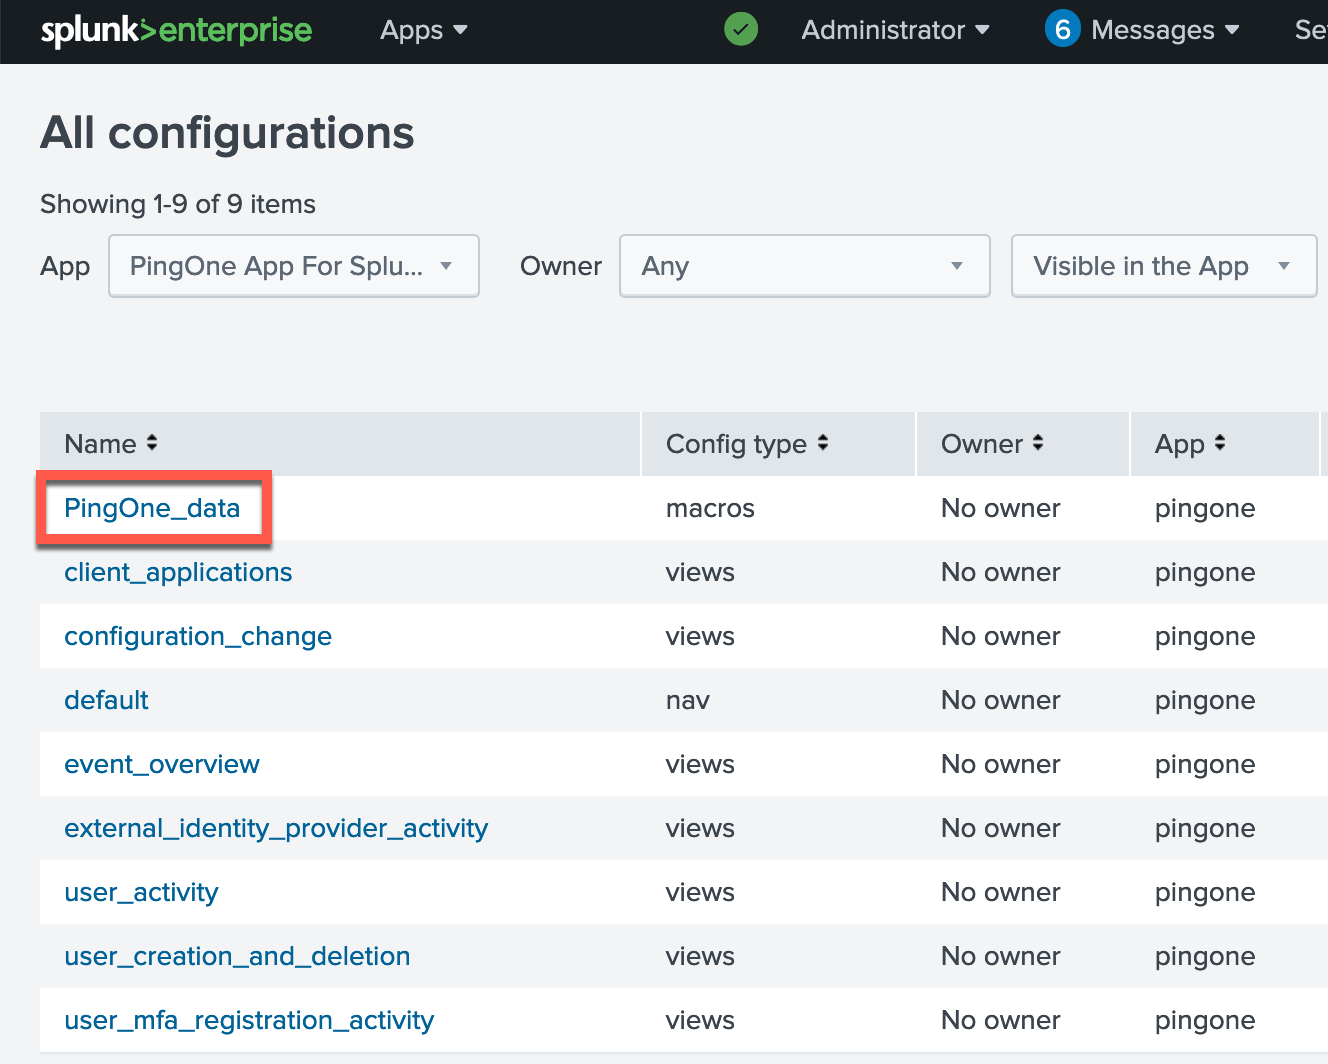
For the App field, filter on PingOne App for Splunk configurations and select the PingOne_data macro.
-
To point the macro to your data, enter your index in the Definition box.
The default is
index=pingone. Below is an example definition.
-
-
Optional: Accelerate your data model to make a summary index of PingOne data.
The summary index results in more efficient population of the dashboards and allows you to populate the tables over larger time ranges.
-
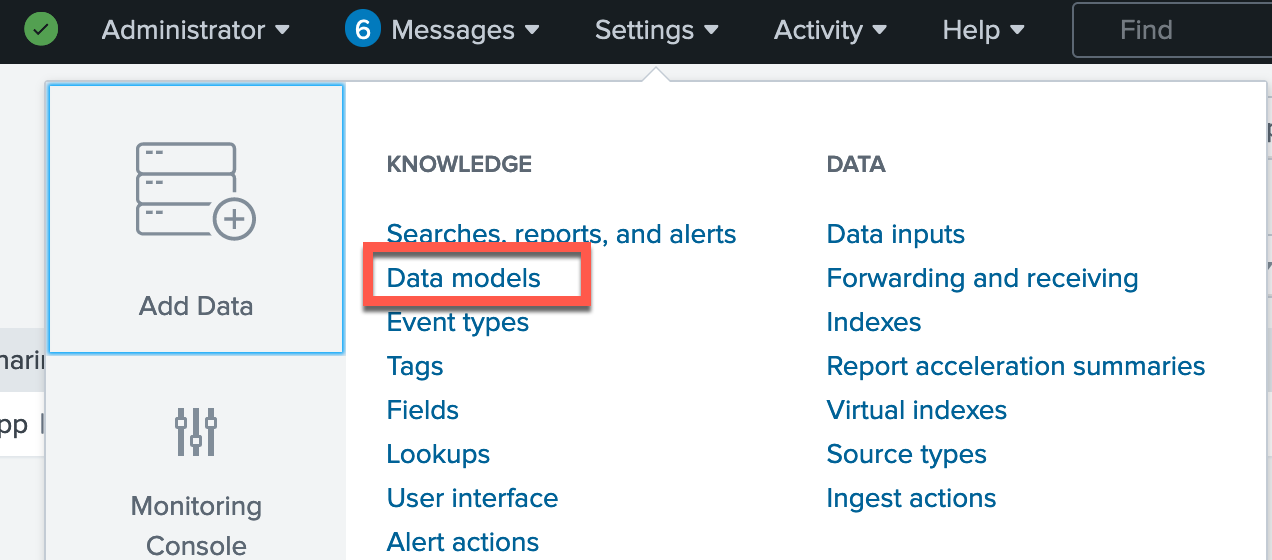
Go to Settings → Data models.
-
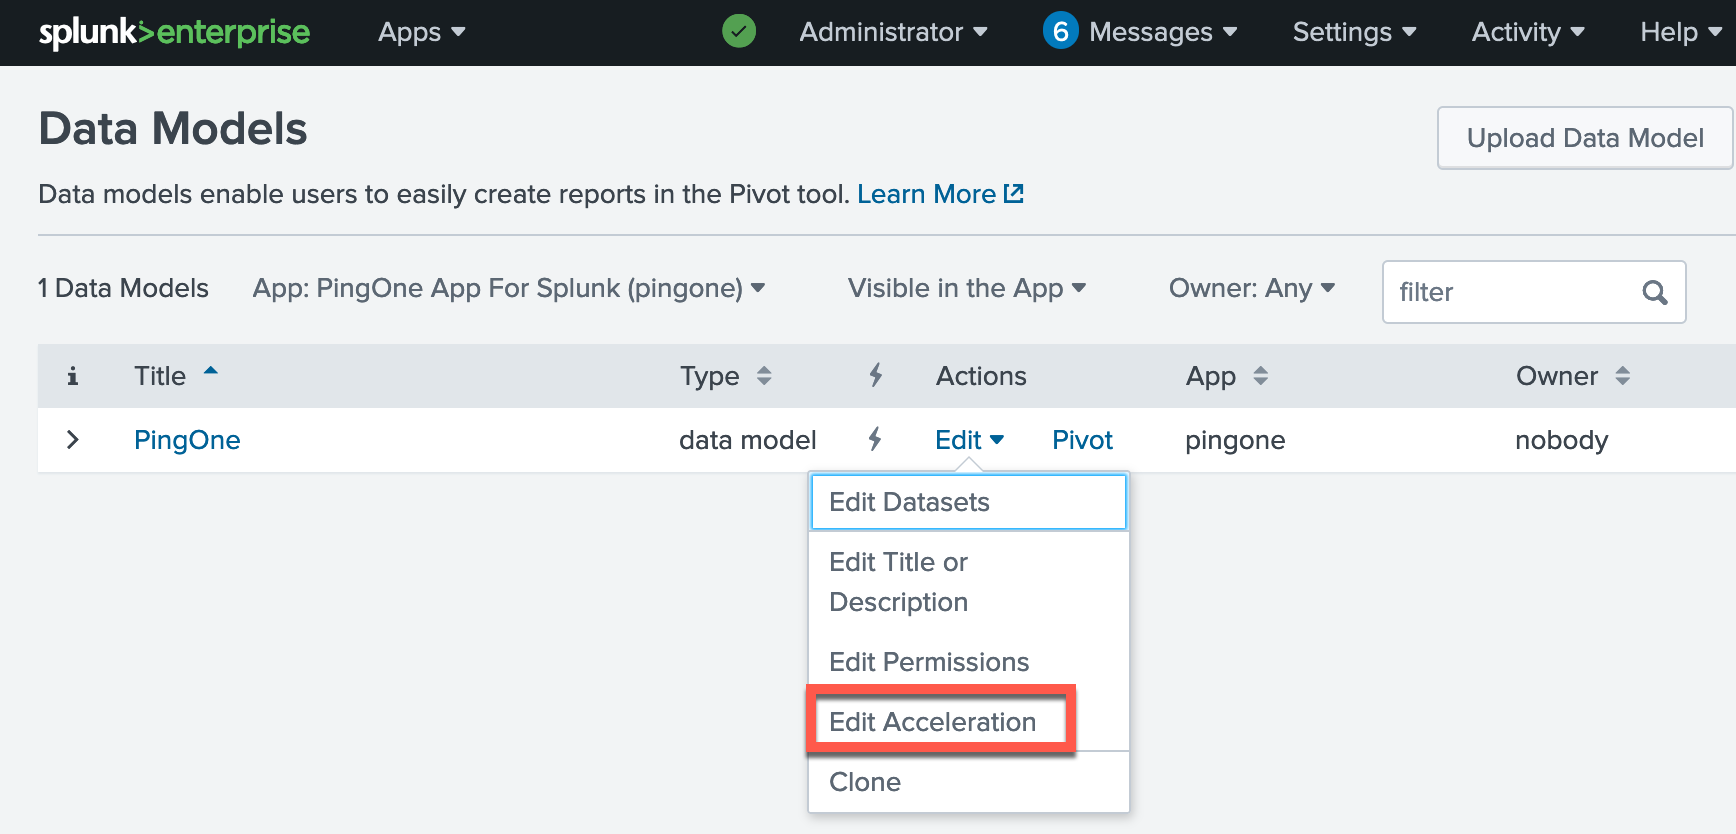
Click Edit → Edit Acceleration for the PingOne data model.
-
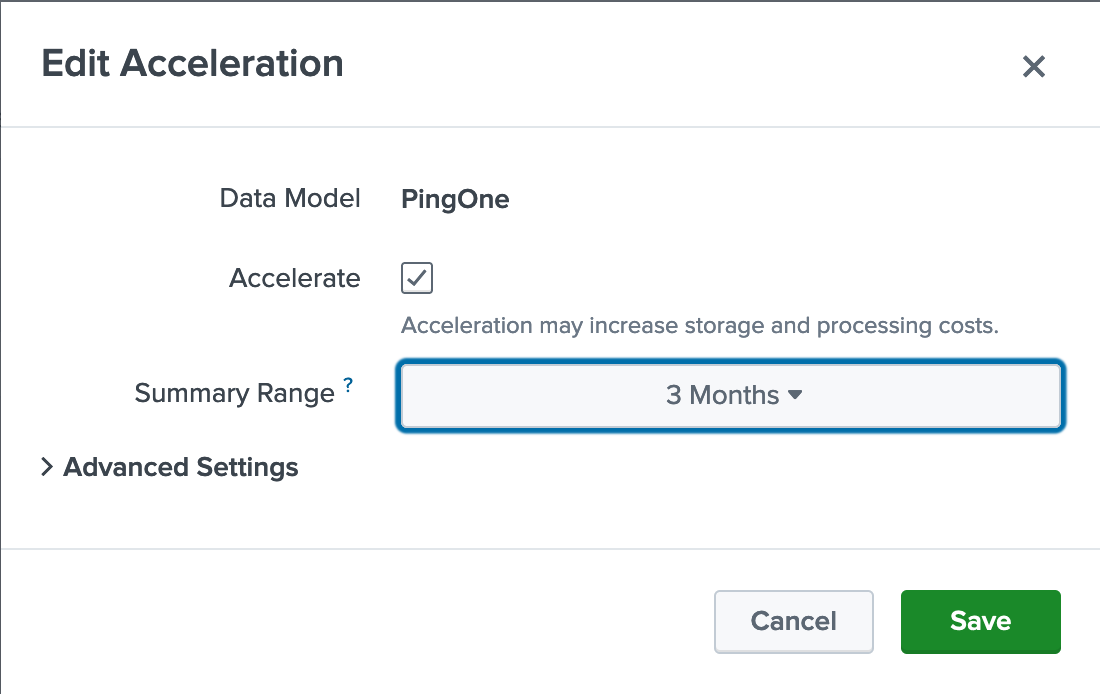
In the Edit Acceleration window, select the Accelerate check box.
-
Select a Summary Range. Click Save.
The dashboards only display accelerated data through the summary range selected, so choose a time range accordingly.
It will take time for the summary index to build.
-