New Authentication Dashboard (early access)
For the purposes of early access, this topic describes the new Authentication Dashboard.
The Authentication Dashboard shows a summary of authentication activity through PingOne authentication for the selected environment, including:
-
Single sign-on (SSO) activity.
-
User self-registration events.
-
PingOne DaVinci success flows from successful authentication attempts.
-
DaVinci failed flows from unsuccessful authentication attempts.
-
Authentication through external identity providers (IdPs) configured in PingOne.
Limitations
The Authentication Dashboard doesn’t display the following activity:
-
DaVinci authentication attempts that result in a timeout or user abandonment
-
DaVinci authentications through social login connectors that bypass the DaVinci flow orchestration service, such as passwordless-only flows or sign-on with social accounts like Google
-
DaVinci authentications that succeed after the user falls back to a previous authentication method following an initial failure
-
Guest checkouts when a user is unable to sign on to their existing account and proceeds as a guest instead
Accessing the dashboard
To access the Authentication Dashboard, in the PingOne admin console, go to Monitoring > Authentication.
Filters
Use filters to refine the data displayed on the dashboard. You can limit data to a specific time range:
-
Today: Displays data for the current day only.
-
From Yesterday: Displays data for the previous day only.
-
Last 7 Days (default): Displays data for the previous 7 days only.
-
Last 30 Days: Displays data for the previous 30 days only.
-
Last 90 Days: Displays data for the previous 90 days only.
-
This Month: Displays data for the current calendar month only.
-
Last Month: Displays data for the previous calendar month only.
-
Custom Range: Enables you to define a date range within the last 6 months. Select a start date and an end date in the date picker, then click Apply.
This filter applies to all charts on the dashboard.
|
The Authentication Dashboard displays data only for the past 6 months. |
Charts
Use the following controls to adjust the charts:
| Icon | Name | Description |
|---|---|---|
|
Maximize |
Expands the chart to fill the dashboard. To minimize the chart, click the icon again. |
|
Menu options |
Options can vary for different types of charts:
|
|
Sort visual |
Sorts the chart data in ascending or descending order. |


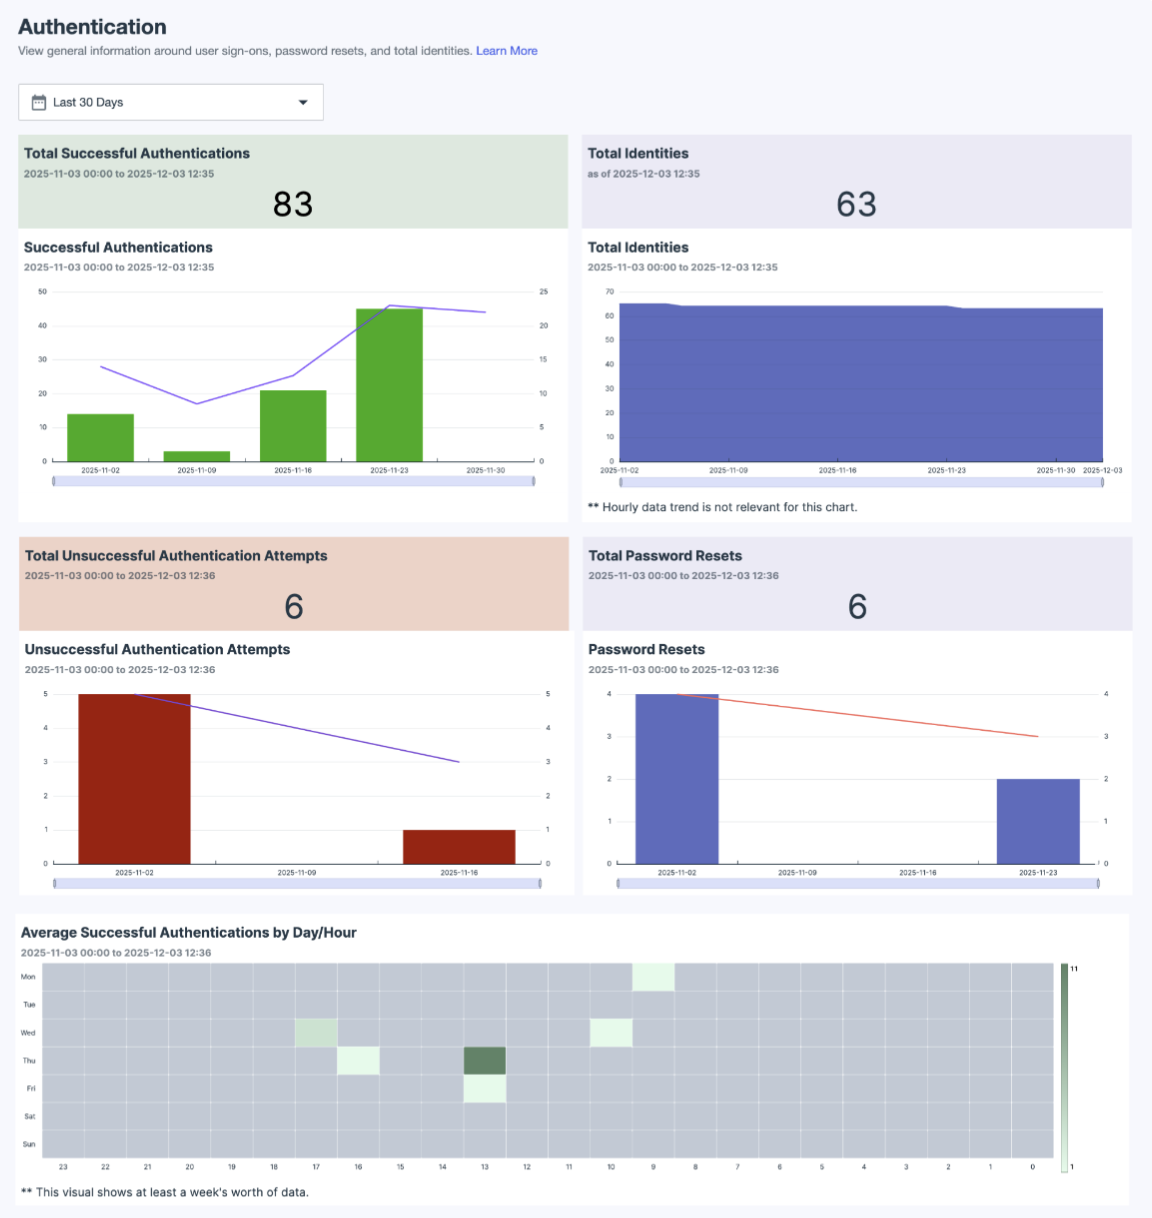
Total Successful Authentications
Displays the total number of successful authentication attempts during the selected time period.
Successful Authentications
Displays a bar chart showing the total number of successful authentication attempts by date and a rolling average line for the selected time period. Hover over a bar to view the number of authentications for that date.
Total Identities
Displays the total number of users in the PingOne directory for the selected time period and a graph showing the total user count by date.
Total Unsuccessful Authentication Attempts
Displays the total number of unsuccessful authentication attempts, including account lockouts and timeouts, during the specified time period.
Unsuccessful Authentication Attempts
Displays a bar chart of unsuccessful authentication attempts, including account lockouts and timeouts, by date, and a rolling average line for the selected time period. Hover over a bar to view the number of unsuccessful attempts for that date.
Total Password Resets
Displays the total number of times users successfully reset their password during the selected time period.
Password Resets
Displays a bar chart of times users successfully reset their password by date and a rolling average line for the selected time period. Hover over a bar to view the number of successful password resets for that date.
Successful Authentications by Day/Hour
Displays a heat map of average authentication activity by hour of the day and day of the week in the end user’s local time zone. The color variations show usage trends throughout an average week.
Hover over the map to see the actual average of successful authentications to more accurately quantify the variation between periods. You can use this information to better understand user habits and identify periods of interest, such as typical highs and lows for authentication attempts.